Kubernetes FinOps: Basics of cluster utilization

Whether you run applications in the cloud or on-premise, optimizing your utilization of the computing hardware you rent or own is a necessary part of operations. The term “FinOps” is joining “DevOps”, “SecOps” and “NetOps” as a critical discipline in IT operations; a key part of FinOps is not just maximum cost reduction, but maintaining resource utilization within defined limits:
- Not so low as to waste money by not allocating resources effectively
- Not so high as to risk application availability – either by unexpectedly exhausting available compute resources when demand increases or by not having enough resources on standby to recover from failures
When talking about Kubernetes cluster utilization, the most visible configuration controls involve Pod container resource reservations and maximums – which Kubernetes calls requests and limits. Most people think of utilization, on the other hand, as how much is actually going on in their cluster, which may be much less than the limits set or even the amounts requested, leaving large amounts of unused resources. The difference between the two can equal a lot of money you’re spending needlessly, meaning you have an opportunity for major cost reduction while still keeping applications healthy.
Scheduling, requests, and consumption
Let’s define a few terms:
Scheduling: Scheduling is the decision of what pods should run where – among other things, the scheduler takes into account a pod’s requests (see below) for resources and how much of each resource each node has free.
Requests: “Request” sounds optional at first, as if it means “please give the container however much you have, up to this much”; however, the scheduler treats a request as a mandatory minimum amount available. The node’s kubelet will then reserve the requested amount of the resource for the container, whether it’s actually using it or not.
Requests aren’t allowed to add up to over 100% of the available amount of the requested resource on the node, and the request amount is reserved immediately and stays reserved until you change the configuration of the containers in the pod. Each resource that can be requested can also have a limit configured; limits can be overcommitted beyond 100%.
If the limit is configured but the request isn’t, the request is considered to be equal to the limit. (This may cause surprising behavior if you haven’t encountered it before; in our next blog post we’ll go into more detail about the side effects of setting requests and limits, or not setting them, in various ways.)
Consumption: This is the term we’ll use for the amount of a resource that a container is actually using – sometimes called “usage” or “utilization”, but to avoid confusion, in this post, we’ll mostly use the term “consumption” to clearly distinguish this concept from requests. This may be more than the request value, but if a resource limit is set, Kubernetes will not allow consumption to exceed the limit value. What happens when a container’s consumption of a resource reaches the limit depends on the kind of resource the limit is set for – in particular, if it’s a “compressible” resource like CPU, the container’s consumption will be throttled; if it’s a “non-compressible” resource like memory, the Pod will be terminated by the kubelet, then rescheduled by the scheduler.
Node utilization models illustrated: The Kubernetes dashboard
The Kubernetes Dashboard isn’t (and isn’t intended to be) a comprehensive cluster management tool. In this case, though, it provides a perfect illustration of the difference between the two models of utilization we mentioned earlier; the screenshots below are taken from an example cluster with a single worker node, looking at the detail view of the node (accessed from the Nodes view by clicking the node name in the list under the charts at the top).
We can see the different definitions of utilization displayed by comparing the time-series “CPU Usage” and “Memory Usage” charts at the top, which show actual CPU and memory consumption, and the circular gauges further below which show the total requests (and limits) of the pods running on the node. (Note that the consumption metrics in the “Usage” charts include processes besides those in the containers of the pods on the node; this won’t really affect our example below since we’ll be looking more at changes than absolute values.)
If you’re comfortable with the command line, you don’t have to use the dashboard to see this info: for the actual resource consumption on a node, run kubectl top node [node name]; to see the total requests and limits of the pods on the node, run kubectl describe node [node name].
Example: Requests and limits vs. consumption
Let’s take a look at an example of a severe disparity between the resources requested for a workload and a much lower consumption of those resources. The first two screenshots below were taken with a pod deployed that runs a busybox container that just sleeps for 3600 seconds, so by default it consumes a small amount of memory, and almost no CPU. The container’s limits are set to 500 MiB of RAM and 500m (500 “millicores”) of CPU. (Remember, since it has limits set, but no requests, Kubernetes automatically sets the unconfigured requests to be the same as the configured limits. We set the pod up this way, instead of just setting its requests directly, to use it for some examples in the next blog post.)
First, take a look at the “Usage” charts:
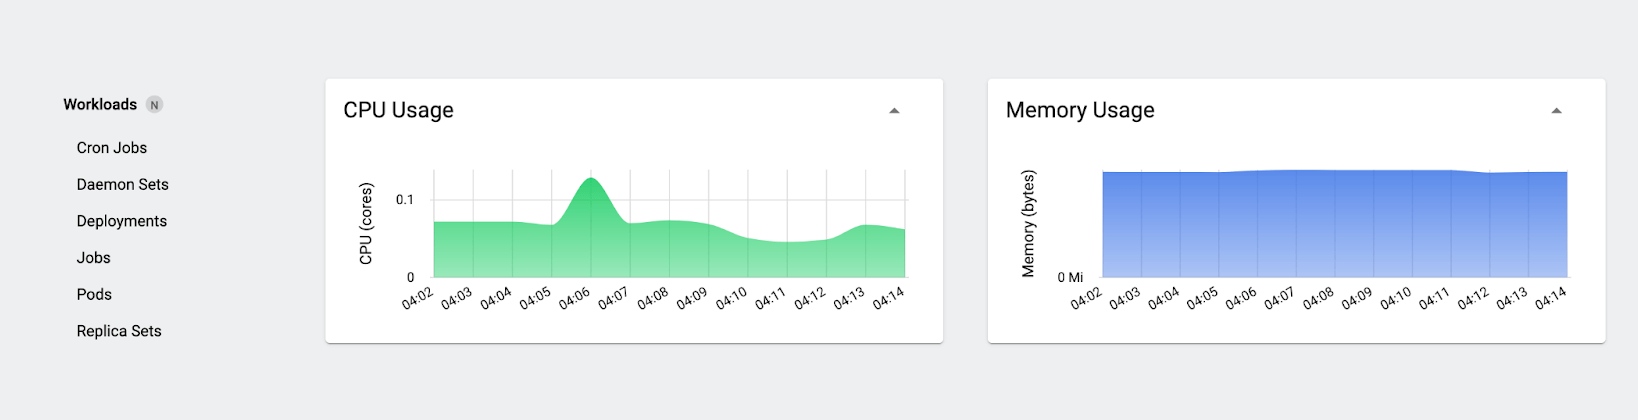
When you look at these charts, you see the consumption view: how much CPU and memory is actually in use. The numbers here will swing up and down slightly even when nothing much is going on. We’re using well under 0.1 core overall, and although it’s not marked on the memory chart axis, we’re using a little over 800MiB of memory.
Now let’s look at the request and limit gauges:
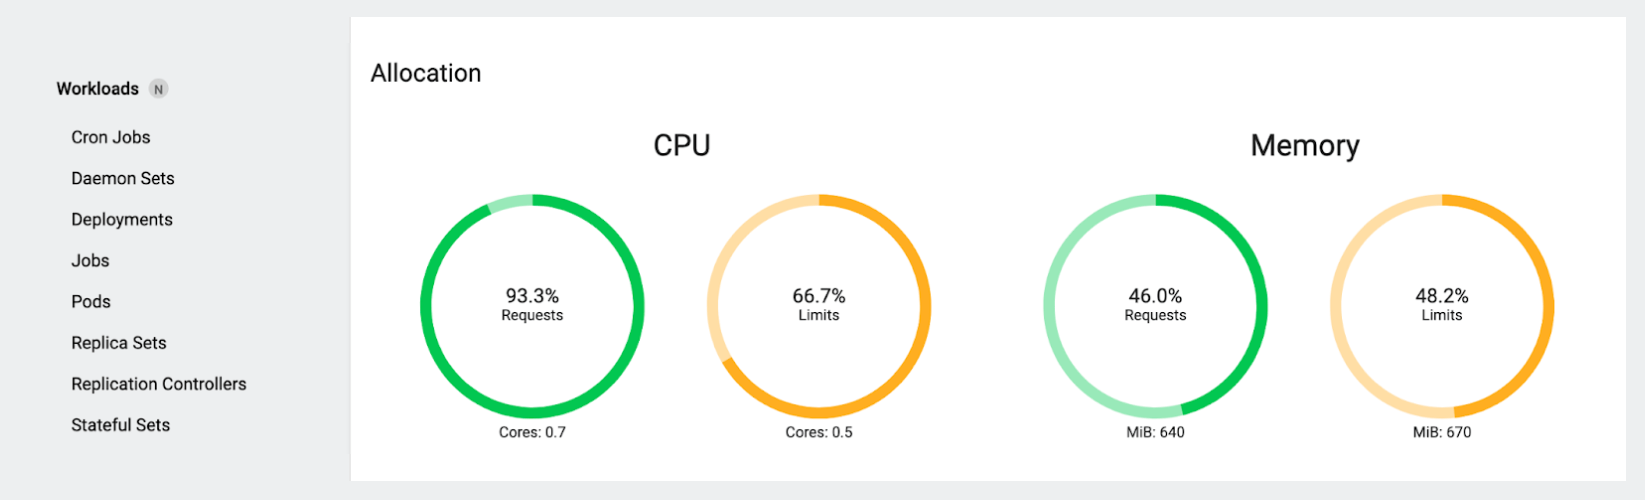
Here, you see a different story: the gauges reflect the total requests (and limits) for the pods running on that node. In a quiet cluster with no autoscaling active and no pods terminating or starting, these numbers tend to stay perfectly static, unless you (or a controller) change things, like scaling a Deployment or deploying a new workload.
Notice that the total CPU limit here is actually less than the requests! At first this seems weird, but it’s simply because our test pod has a CPU limit, no other pods do, and the total requests of all the pods that have CPU requests configured add up to more than the CPU limit on our test pod. Also notice that the total requests of 0.7 cores (700 millicores) are much, much more than the actual consumption shown earlier of well under 0.1 core.
Let’s delete our test pod and observe the results. Looking at the Usage charts first:
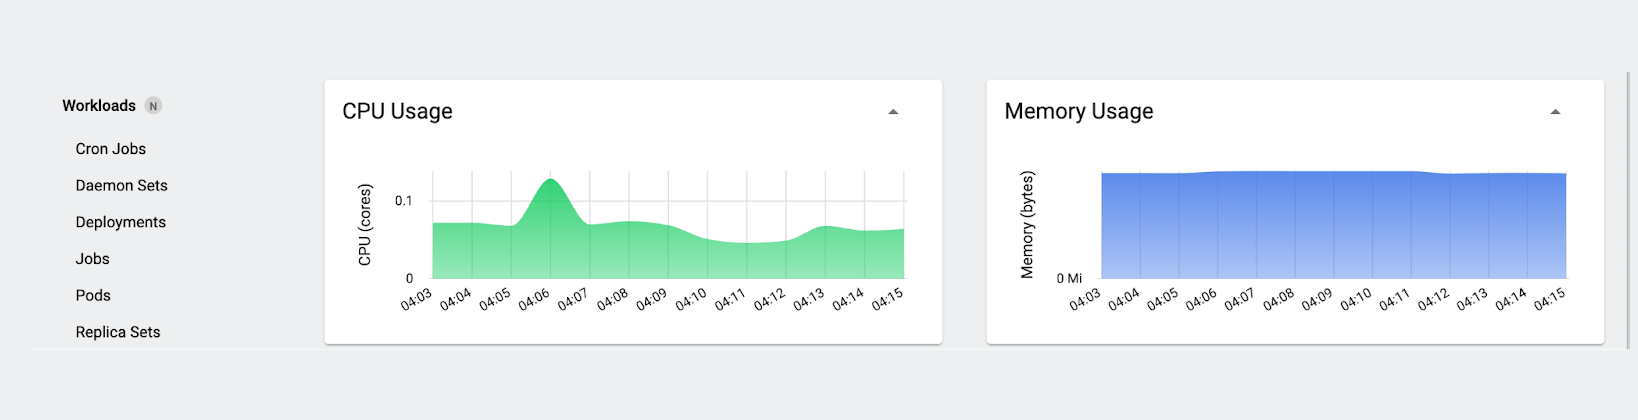
The first thing we notice is what doesn’t happen: the CPU and memory consumption don’t change significantly. This isn’t that surprising – intuitively, if you’ve run “sleep” workloads for testing outside Kubernetes, you know that system resource consumption barely changes when you run them or terminate them, and the same holds true here. (If we wanted to, we could use a utility like stress-ng to simulate a given amount of CPU or memory demand, but it’s not necessary for this example.)
Now let’s look at our gauges again:
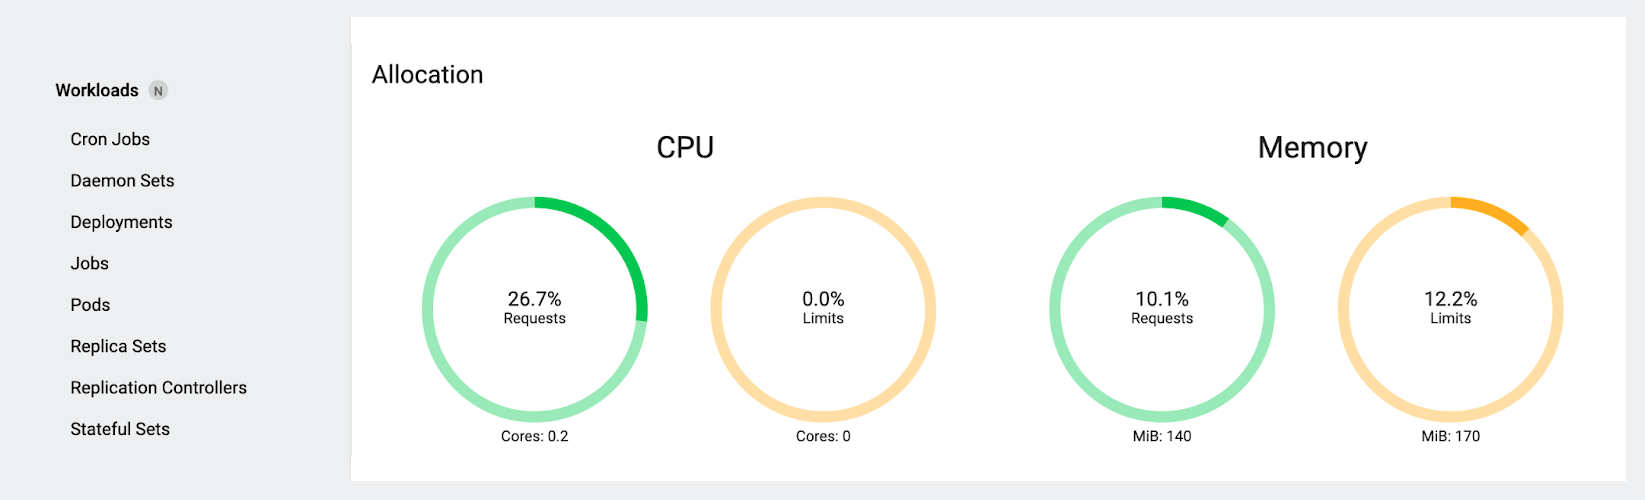
There’s a big difference here! Since we deleted the only pod with a limit, our total CPU limit has gone to zero (which again, seems weird at first glance, but is actually expected and makes sense the way the dashboard is doing the math), and the total CPU requests have gone down as well. Just as dramatically, the memory requests and limits have gone down from nearly 50% of the node’s capacity to just over 10%.
We did this example “backwards” (starting with our example workload deployed and then removing it, instead of starting with a fresh cluster first and then creating the pod) because it better reflects the real world of deploying applications in Kubernetes: if you have inefficient pod request configurations, you won’t necessarily know that until after deployment.
If a lot of your workloads look like our example pod (even a little bit), you could be wasting a lot of money (especially when running a managed offering like EKS), literally for nothing, on your clusters without realizing it.
What should you do about inefficient resource configurations?
We just looked at an example where utilization (measured by what we defined as “consumption” at the start) is very low compared to the resources taken out of circulation for it; we could reduce the resource requests of the pod’s container to resolve this. On the other hand, what if the actual consumption were routinely well above the configured requests? You could increase the request values so that whichever node the pod is scheduled onto, there are enough resources on that node to run the pod reliably long-term. If an application has a tendency to suddenly eat all available memory, you might want to lower its memory limit (or set one if it doesn’t have one) so it doesn’t crowd out more critical workloads. What about other scenarios in which you want to manipulate how pods are scheduled or evicted when resources are tight?
In the following posts, we’ll discuss some of the mechanisms Kubernetes provides to control pod scheduling and optimize node utilization; look at the pros and cons of tools like Karpenter and the built-in autoscalers that are frequently used to automate management of those mechanisms; and give an overview of a new tool Platform9 is developing to address these concerns more holistically.
Additional reading
Next blog post in this series: Kubernetes FinOps: Resource management challenges
Kubernetes documentation: Resource Management for Pods and Containers