Top 6 FinOps KPIs for EKS
The FinOps foundation is a treasure trove of useful frameworks, guides and importantly KPIs and I would recommend everyone dive in and explore. However, sometimes frameworks, guides and KPIs can be difficult to apply without a concrete example.
In this blog I will share what we used at Platform9 to introduce FinOps to our free SaaS Managed Kubernetes platform (no longer available) and share how it influenced us to build Elastic Machine Pool, our FinOps solution for EKS.
Where do KPIs live within the FinOps Framework?
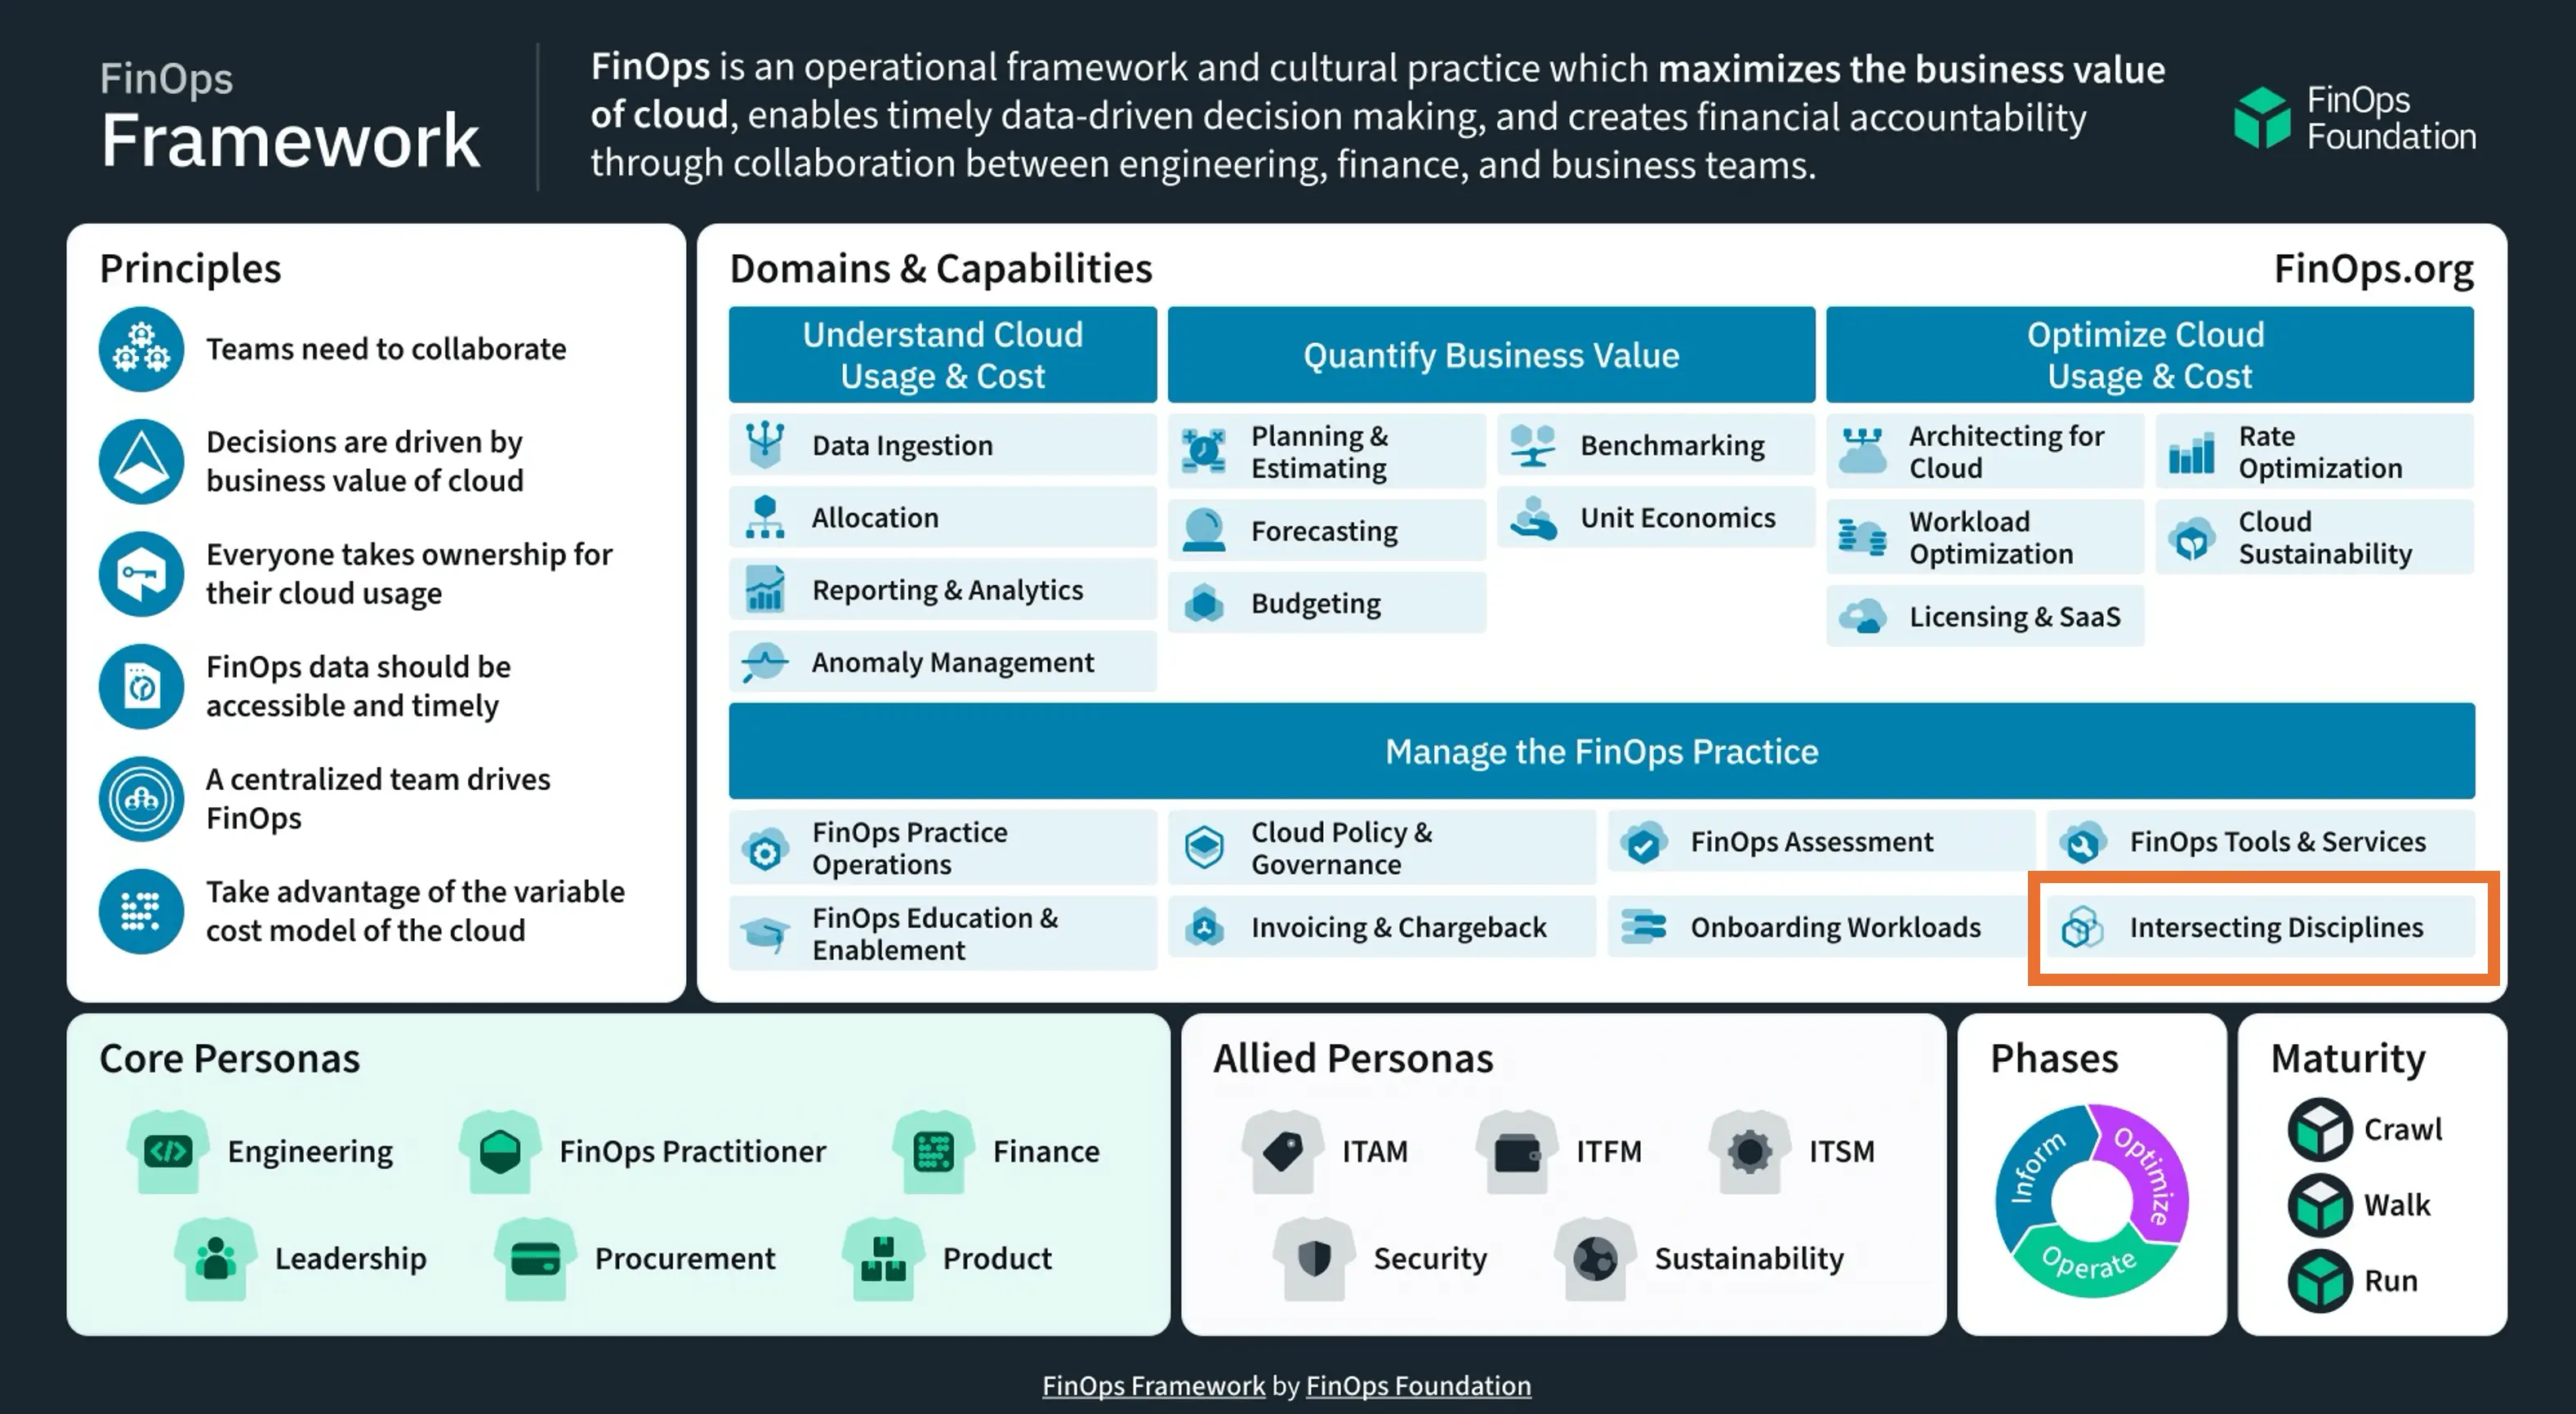
KPIs (Key Performance Indicators) are an integral part of the FinOps framework, specifically within the “Intersecting Disciplines” capability. This capability focuses on coordinating activities with other IT disciplines and frameworks, such as ITAM, ITFM, Sustainability, and Security, to ensure alignment and collaboration across the organization.
Furthermore, the FinOps framework emphasizes the importance of KPIs in the “Inform” phase, where organizations aim to understand fully loaded costs, allocate costs back to the business, and perform performance benchmarking. KPIs such as the percentage of untagged resources, total spend by period, and the percentage of budgeted spend are commonly used in this phase.
FinOps Foundation KPIs
The FinOps foundation KPIs can be found on github are freely shared under a creative commons license for all to use. The base list includes 28 KPIs that range from the use of reserved instances to untagged resources, to unit costs.
EKS FinOps KPIs
Before jumping in and setting KPIs I can’t stress how important it is to set the right foundation; you must have a budget, and you must have at least one unit cost measure.
Setup a unit cost
- Unit Cost could be a measure per user signup, items sold,
Set a budget
- Without a budget many elements within FinOps become difficult. A simple historic cost approach will provide a budget.
When we operated Platform9 Freedom Tier our primary unit cost was a per active user, secondary was per signup. Our Budget was set prior to launch are reviewed every 3 months. We reviewed all KPIs weekly. What did we learn, and what did we track?
EKS KPI #1 – % of spot instance vs other coverage
To calculate this KPI:
- % of spot instance vs other coverage = (Sum of All Spot Instance / Sum of All Instance) Types X 100
The KPI “% of spot instance vs other coverage” refers to the percentage of your cloud compute instances that are running on spot instances compared to other instance types like on-demand or reserved instances. As we were operating a free product it was paramount to leverage the cheapest possible resources. To learn more about our experience using Spot Instances read our blog about Spot Quakes.
EKS KPI #2 – Total bill vs. forecast — including variance % of forecast: actual bill
To calculate this KPI:
- Variance % = (Actual Bill – Forecasted Amount) / Forecasted Amount x 100
- The “Total bill vs. forecast — including variance % of forecast: actual bill” KPI is a crucial metric in FinOps that measures the accuracy of cloud spending forecasts against the actual cloud bill received.
Here’s an explanation of this KPI:
- Total bill: This refers to the total amount billed by the cloud provider for the given period (e.g., monthly, quarterly).
- Forecast: This is the predicted or estimated cloud spending for the same period, typically based on historical data, anticipated usage, and other factors.
- Variance %: This is the percentage difference between the forecasted amount and the actual bill. It is calculated as:
- Variance % = (Actual Bill – Forecasted Amount) / Forecasted Amount x 100
A positive variance indicates that the actual bill exceeded the forecast, while a negative variance means the actual bill was lower than the forecast.
This KPI was used in-context with marketing campaigns, webinars and general signup data. In absence of any “push” to increase signups and active users a positive variance meant time to take action.
EKS KPI #3 – Unit Cost: Per Signup & Per Active User
To calculate this KPI:
- Cost Per Active User = Total active user / Total cost
In essence, unit metrics bridge the gap between cloud costs and realized business value, a core tenet of the FinOps practice. Properly implemented, they foster a culture of shared cost accountability across the organization. Tracking this was critical in measuring the impact of each week’s release and backend scale of our services.
EKS KPI #4 – Rightsizing opportunity value
The “Rightsizing opportunity value” KPI in FinOps refers to the potential cost savings that can be achieved by optimizing the sizing of cloud resources to match actual workload requirements.
This is why we built Elastic Machine Pool – We found no amount of bin-packing and rightsizing can reduce unused resources to ZERO.
Cloud cost and unused capacity
The reason is that resources like EC2 instances or databases are often over-provisioned, meaning they have more compute power, memory, or storage than required for the workload they are running. This leads to unnecessary costs as you are paying for resources that are not being fully utilized. In the data center this ‘over-provisioning’ was the goal, in cloud, ‘over-provisioning’ is AWS profit! EMP allows you to take that profit back!
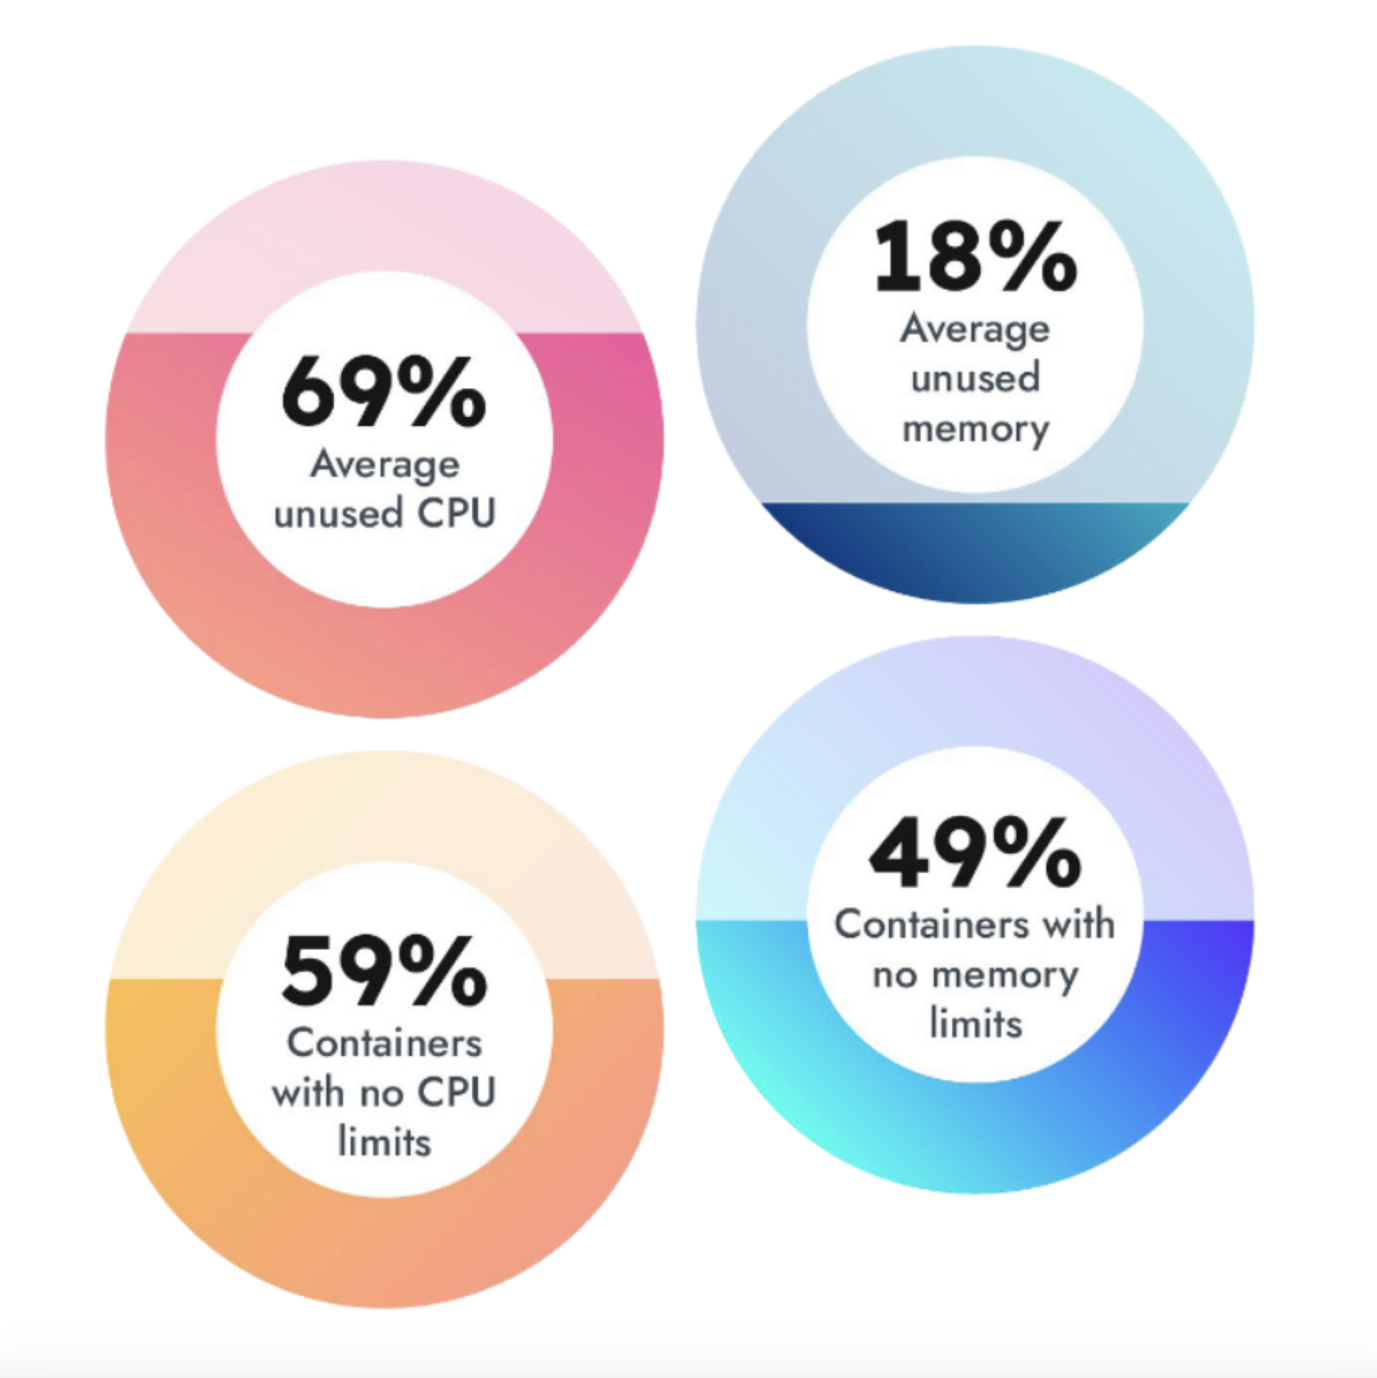
How bad is it? Within EKS over-provisioning is often 40%, in some cases as much as 70%.
- Read more in Sysdig 2023 Cloud-Native Security and Usage Report.
Tracking this KPI is important because it highlights potential areas for cost optimization without impacting performance. A high rightsizing opportunity value indicates significant potential savings by rightsizing resources.
To calculate this KPI:
- Identify over-provisioned resources by analyzing utilization metrics like CPU, memory, disk I/O etc. over a period of time.
- Determine the right-sized instance type/size that could handle the workload based on the utilization data.
- Calculate the cost difference between the existing over-provisioned resource and the right-sized resource.
- Sum up the cost differences across all over-provisioned resources to get the total “rightsizing opportunity value”
- To solve this KPI, implement EMP and we automate everything.
EKS KPI #5 – % unattached elastic IPs
To calculate this KPI:
- % unattached Elastic IPs = (Number of unattached Elastic IPs / Total Elastic IPs) x 100
The “% unattached elastic IPs” KPI in FinOps refers to the percentage of Elastic IP addresses (EIPs) in your cloud environment that are not associated with any running resources, such as EC2 instances or Elastic Network Interfaces (ENIs).
Elastic IPs are static, public addresses designed for dynamic cloud computing. They are allocated to your cloud account and can be remapped to different resources as needed. However, if an Elastic IP is not associated with any resource, you are still charged a small hourly fee by the cloud provider for holding that IP address.
Tracking this KPI is important for cost optimization because:
- Identifying unused resources: Unattached Elastic IPs represent resources that are not being utilized but are still incurring costs. Monitoring this KPI helps identify and eliminate such unused resources.
- Cost savings: By releasing unattached Elastic IPs, you can reduce your monthly cloud bill and save on unnecessary charges.
- IP address management: Keeping track of unattached IPs helps maintain an efficient inventory of IP addresses and prevents address exhaustion.
As we actively off-boarded inactive users after 30 days we were always looking for orphaned resources.
EKS KPI #6 – Platform9 Specific: Suspended Users
The last KPI we tracked was the number of suspended users. Initially our service was not built to scale to zero. We discovered whilst tracking our unit economics for Active Users and Signups that our per inactive user cost was generating significant losses. We reviewed our off-boarding process, but noticed that some users just needed additional time, so deleting their account was not a great idea.
Our team changed the architecture of our platform and introduced the ability to scale to zero. This meant that inactive users cost us near zero.
Earned Value Management: Cost Performance Indicator
What I wish I knew in March 2020! Earned Value Management is a project management technique that can be applied to FinOps. It instantly provides you the real-time view into your benchmarks, unit metrics and forecast. Applied to our free product we would have noticed the trends for our signups, active and inactive users much faster. Specifically the Cost Performance Indicator KPI, if it dips below 1, it’s time to take action!

Why did we build Elastic Machine Pool?
After investing in a FinOps practice and experiencing first-hand how no volume of tuning, resizing and automation could reduce our waste to zero we decided that the concept of over provisioning was the best approach. Using overprovisioning we could turn unused, allocated resources into utilized compute. But how can this be done inside AWS where EC2 instances are already VMs?
Some background: Kubernetes works by scheduling Pods with a set-amount of resources. When the infrastructure running the Pods hits its capacity limit, Kubernetes can add more resources, more nodes. In AWS these are EC2 instances. We have a great blog on Requests, Limits and Scaling.
The catch: Unused resources are waste that you pay for. This is because EC2 instances are VMs that run on bare metal inside AWS and users are assured performance as the noisy-neighbor risk has been removed (AWS doesn’t overprovision bare metal). The waste is created when a Pod is deployed with a request set at 4GB RAM and it’s not using all 4GB. Let’s say you have waste of 1.5GB. Now you can resize the request down to 2.5GB, but as soon as a new release is made the utilization can change and your app could crash. This is an unending cycle that is further exacerbated by changes in user load which cause usage to fluctuate.
The question: How do you remove this waste? You remove it by using overprovisioning, the same way it was removed in 2007 when everyone started using VMware. We remove it from EKS by using virtual machines with over provisioning inside of your AWS, on AWS Metal. We call them Elastic VMs, EVM for short.
We created EMP because no amount of tuning will ever remove waste as the load will always fluctuate and the code constantly changes. EMP solves waste by allowing you to use Virtual Machines inside of AWS, running on AWS Metal, all inside your AWS account. By using a VM you can overprovision the bare metal, thus transforming one Pods “waste” into another Pods “active” resource.

- Top 5 considerations for migrating off VMware - September 20, 2024
- FinOps: Applying Earned Value Management to maximize ROI - June 18, 2024
- Top 6 FinOps KPIs for EKS - June 17, 2024