

This is an excerpt from The Gorilla Guide to Kubernetes in the Enterprise, written by Joep Piscaer.
Previous Chapters:
- Chapter 1: The Changing Development Landscape
- Chapter 2: Kubernetes Concepts and Architecture
- Chapter 3: Deploying Kubernetes
You can download the full guide here.
Now that you’ve deployed a basic Kubernetes cluster, let’s review what it takes to put it to work for mission-critical applications in the enterprise.
Kubernetes RBAC: Giving Users Access
Kubernetes uses Role-based Access Control (RBAC) to regulate user access to its resources by assigning roles to users (see illustration below). While it’s possible to let all users log in using full administrator credentials, most organizations will want to limit who has full access for security, compliance and risk management reasons.
Kubernetes’ approach allows administrators to limit the number of operations a user is allowed, as well as limit the scope of said operations. In practical terms, this means users can be allowed or
disallowed access to resources in a namespace, as well as granular control over who can change, delete or create resources.
RBAC in Kubernetes is based on three key concepts:
- Verbs: This is a set of operations that can be executed on resources. There are many verbs, but they’re all Create, Read, Update, or Delete (also known as CRUD).
- API Resources: These are the objects available on the clusters. They are the pods, services, nodes, PersistentVolumes and other things that make up Kubernetes.
- Subjects: These are the objects (users, groups, processes) allowed access to the API, based on Verbs and Resources.
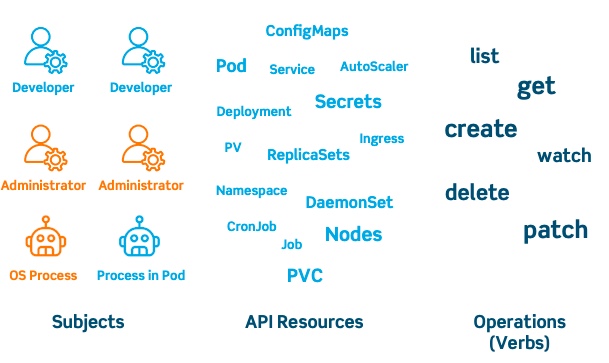
These three concepts combine into giving a user permission to execute certain operations on a set of resources by using Roles (which connects API Resources and Verbs) and RoleBindings (connecting subjects like users, groups and service accounts to Roles).
Users are authenticated using one or more authentication modes. These include client certificates, passwords, and various tokens. After this, each user action or request on the cluster is authorized against the rules assigned to a user through roles.
There are two kinds of users: service accounts managed by Kubernetes, and normal users. These normal users come from an identity store outside Kubernetes. This means that accessing Kubernetes with multiple users, or even multiple roles, is something that needs to be carefully thought out. Which identity source will you use? Which access control mode most suits you? Which attributes or roles should you define? For larger deployments, it’s become standard to give each app a dedicated service account and launch the app with it. Ideally, each app would run in a dedicated namespace, as it’s fairly easy to assign roles to namespaces.
Kubernetes does lend itself to securing namespaces, granting only permissions where needed so users don’t see resources in their authorized namespace for isolation. It also limits resource creation to specific namespaces, and applies quotas.
Many organizations take this one step further and lock down access even more, so only tooling in their CI/CD pipeline can access Kubernetes, via service accounts. This locks out real, actual humans, as they’re expected to interact with Kubernetes clusters only indirectly.
Monitoring and Ensuring Cluster Health
The easiest way of manually checking your cluster after deployment is via the Kubernetes Dashboard. This is the default dashboard and is usually included in new clusters. The dashboard gives a graphical overview of resource usage, namespaces, nodes, volumes, and pods. The dashboard provides a quick and easy way to display information about the cluster. Because of its ease of use, it’s usually the first step in a health check.
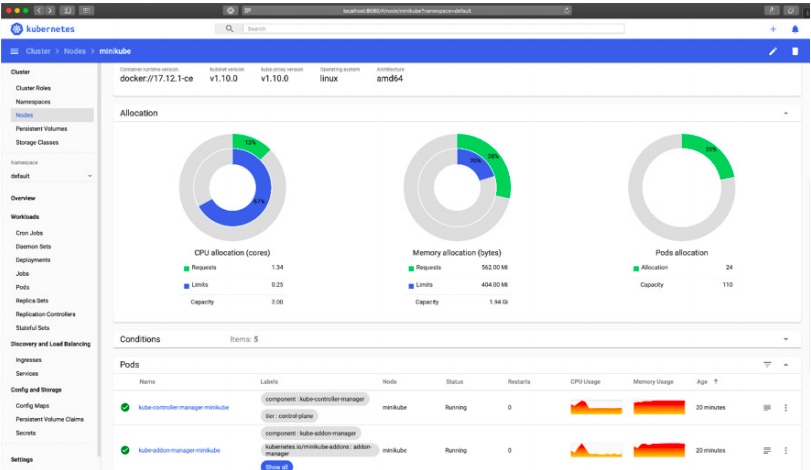
You can also use the dashboard to deploy applications, troubleshoot deployments and manage cluster resources. It can fetch an overview of applications running on your cluster, as well as create or modify individual Kubernetes resources. For example, you can scale a deployment, initiate a rolling update, restart a pod, or deploy new applications using a wizard.
The dashboard also provides information on the state of Kubernetes resources in your cluster, and any errors that may have occurred.
After deployment, it’s wise to run standard conformance tests to make sure your cluster has been deployed and configured properly. The standard tool for these tests is Sonobuoy.
Clusters running as part of a service in the public cloud, like Amazon EKS, Google GKE or Azure AKS, will benefit from the managed service aspect: the cloud provider takes care of the monitoring and issue
mitigation within the Kubernetes cluster. An example is Google’s Cloud Monitoring service.
Monitoring and Ensuring Application Health
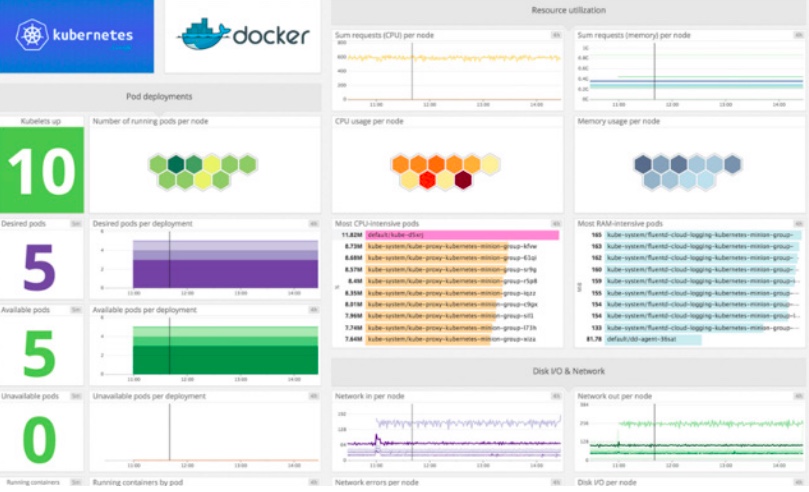
Most real-world Kubernetes deployments feature native, full metrics solutions. Generally speaking, there are two main categories to monitor: the cluster itself, and the pods running on top.
Kubernetes Cluster Monitoring
For cluster monitoring, the goal is to monitor the health of the Kubernetes cluster, nodes, and resource utilization across the cluster. Because the performance of this infrastructure dictates your application performance, it’s a critical area.
Monitoring tools look at infrastructure telemetry: compute, storage, and network. They look at (potential) bottlenecks in the infrastructure, such as processor and memory usage, or disk and network I/O. These resources are an important part of your monitoring strategy, as they’re limited to the capacity procured, and costly to expand.
There’s another important reason to study these metrics: they define the behavior of the infrastructure on which the applications run, and they can serve as an early warning sign of potential issues. Should
issues be identified, you can mitigate the issue before applications dependent on that infrastructure are impacted.
Kubernetes Pod Monitoring
Pod monitoring is slightly more complex. Not only do you want to correlate metrics from Kubernetes with container metrics, you also want application metrics. This requires a metrics and monitoring solution that hooks into all layers, and possibly into layers outside of the Kubernetes cluster.
As applications become more complex and distributed across multiple services, pods and containers, monitoring tools need to be aware of the taxonomy of applications, and understand dependencies between services and the business context in which they operate.
This is where solutions like DataDog, NewRelic and AppD come in. While these are proprietary solutions, they cover the whole stack: from infrastructure, Kubernetes and containers, to application tracing. This provides a complete picture of an application, as well as transactional traces across the entire system for monitoring of the end-user experience. These solutions offer a unified metrics and monitoring experience and include rich dashboarding and alerting feature sets. Often, these products include default dashboard visualizations for monitoring Kubernetes, encompassing many standard integrations
with components in the application stack to monitor up and down.
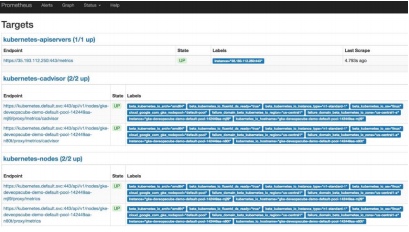
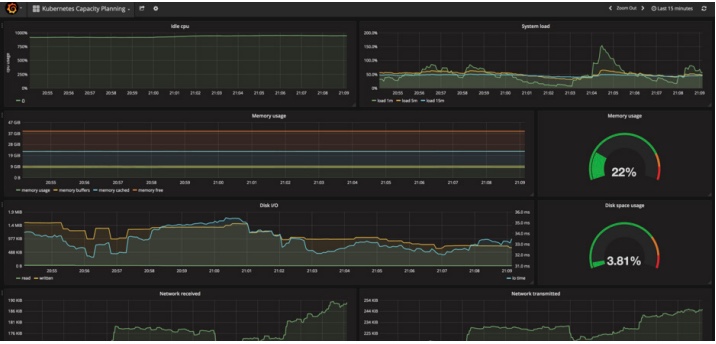
Kubernetes Monitoring with Prometheus
![]() The most popular Kubernetes monitoring solution is the open source Prometheus, which can natively monitor the clusters, nodes, pods, and other Kubernetes objects.
The most popular Kubernetes monitoring solution is the open source Prometheus, which can natively monitor the clusters, nodes, pods, and other Kubernetes objects.
It’s easily deployed via kube-prometheus, which includes AlertManager for alerting, Grafana for dashboards, and Prometheus rules combined with documentation and scripts. It provides an easy to operate, end-to-end Kubernetes cluster monitoring solution.
This stack initially monitors the Kubernetes cluster, so it’s pre-configured to collect metrics from all Kubernetes components. It also delivers a default set of dashboards and alerting rules. But it’s easily extended to target multiple other metric APIs to monitor end-to-end application chains.
Prometheus can monitor custom application code and has integrations with many database systems, messaging systems, storage systems, public cloud services, and logging systems. It automatically discovers new services running on Kubernetes.
* BTW – If you don’t want to go through the trouble setting up and managing Prometheus on your own, check out our Managed Prometheus solution for multi-tenant, out-of-the-box Prometheus monitoring with 99.9% SLA on any environment.
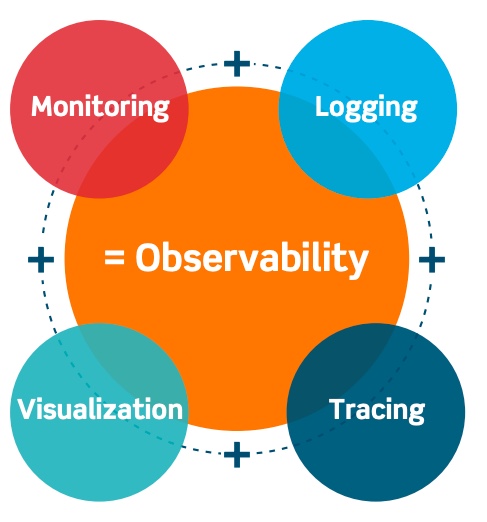
Kubernetes Logging and Tracing
Collecting metrics is just part of the puzzle. In a microservices landscape, we need to observe behavior across the multitude of microservices to get a better understanding of the application’s performance. For this reason, we need both tracing and logging.
For centralized log aggregation, there are numerous options. The default option is Fluentd, a sister project of Kubernetes. On top of that, transactional tracing systems like Jaeger give insights into the user experience as they traverse the microservice landscape.
To dive deeper into Kubernetes Logging and monitoring, see our blog series on the EFK Stack.
Persistent Storage
Managing storage in production is traditionally one of the most complex and time-consuming administrative tasks. Kubernetes simplifies this by separating supply and demand.
Admins make existing, physical storage and cloud storage environments alike available using PersistentVolumes. Developers can consume these resources using Claims, without any intervention of the admins at development or deploy time. This makes the developer experience much smoother and less dependent on the admin, who in turn is freed up from responding ad-hoc to developer requests.
To learn more about Dynamic Volumes and the Container Storage Interface (CSI) see our Kubernetes Storage blog, which also includes a Minikube tutorial so you can hack on the inner workings of storage in Kubernetes!
There’s More:
 On the next posts we’ll dive deeper into enterprise Kubernetes solutions, key use cases, and best practices for operating Kubernetes in Production, at scale.
Can’t wait?
To learn more about Kubernetes in the Enterprise, download the complete guide now.
Author


