

This is a 3-part series on Kubernetes monitoring and logging:
- Requirements and recommended toolset (this article)
- EFK Stack – Part 1: Fluentd Architecture and Configuration
- EFK Stack – Part 2: Elasticsearch Configuration
You have a K8s cluster. Now what?
For a production-grade Kubernetes cluster, monitoring, alerting and log aggregation are essential. In this article, we are going to focus on why is it necessary and the requirements for a production-grade logging system.
Why do we need a separate service for logging in the first place?
Kubernetes is great at running distributed applications. In such deployments, as requests get routed between services running on different nodes, it is often imperative to analyze distributed logs together while debugging issues. In fact, the 12 Factor App Principle for designing microservices and cloud-native apps instructs developers to publish log output as Stream. Kubernetes expects the application services to log output to stdout stream and provides a simple command to get logs from a pod. However, it is extremely basic and often not useful. We see that primarily around 2 issues:
- A production deployment may consist of hundreds of pods, and so a scalable solution is needed.
- Kubernetes does not keep log history. Only recent logs are typically available. Since it is also a very dynamic environment, logs from an old instance of a pod may not be available.
Logging Stack:
Typically, three components make up a logging system.
- Log Aggregator: This component collects logs from pods running on different nodes and route them to a central location. A good log aggregator must be:
-
- Efficient: uses relatively minor CPU and memory resources to large log data, otherwise the log aggregator overhead eats into system resources that are meant for production service
- Dynamic: log aggregator must adopt quickly to changes in the Kubernetes deployment. It should be able to switch as pods churn through.
- Extensible: the log aggregator must be able to plug into a wide range of log collection, storage and search systems.

Considering these aspects, fluentd has become a popular log aggregator for Kubernetes deployments. It is small, efficient and has a wide plugin ecosystem.
-
- Log Collector/Storage/Search: This component stores the logs from log aggregators and provides an interface to search logs efficiently. It should also provide storage management and archival of logs. Ideally, this component should be resilient to node failures, so that logging does not become unavailable in case of infrastructure failures.
 Elasticsearch is a good choice here, as it can ingest logs from fluentd, creates inverted indices on structured log data making efficient search possible, and has multi-master architecture with ability to shard data for high availability.
 - UI and Alerting: Visualizations are key for log analysis of distributed applications. A good UI with query capabilities makes it easier to sift through application logs, correlate and debug issues. Custom dashboards can provide high level overview of the health of the distributed application.
 Kibana from Elasticsearch can be used as the UI for the log storage, and will be explored as an option here.Alerting is typically an actionable event in the system. It can be set up in conjunction with logging and monitoring.
Day N Management of Logging Stack:
After the logging system is deployed, it is important to monitor it as part of overall infrastructure monitoring, because failures related to collecting logs can mask serious issues in production deployments.
The trickiest component in logging infrastructure is the collection and search system. It is typically a complex stateful application. When either a node, network or storage failures occur, expert knowledge is needed to restore it to a good state. Some of the important considerations are:
- Node failures: On a node failure, does the system recover to correct state? Does it rebalance indexed data to resume operations at expected performance level?
- Storage failures: Are redundant copies of log data stored? Is the system correctly able to recover from storage failures?
- Network failures: In case of network failures, do log aggregators maintain local buffers? Is sufficient space configured so that logs can be held locally until the network comes back?
Logging Stack Architecture:
Based on our discussion so far, a logging system in Kubernetes can be depicted as follows:
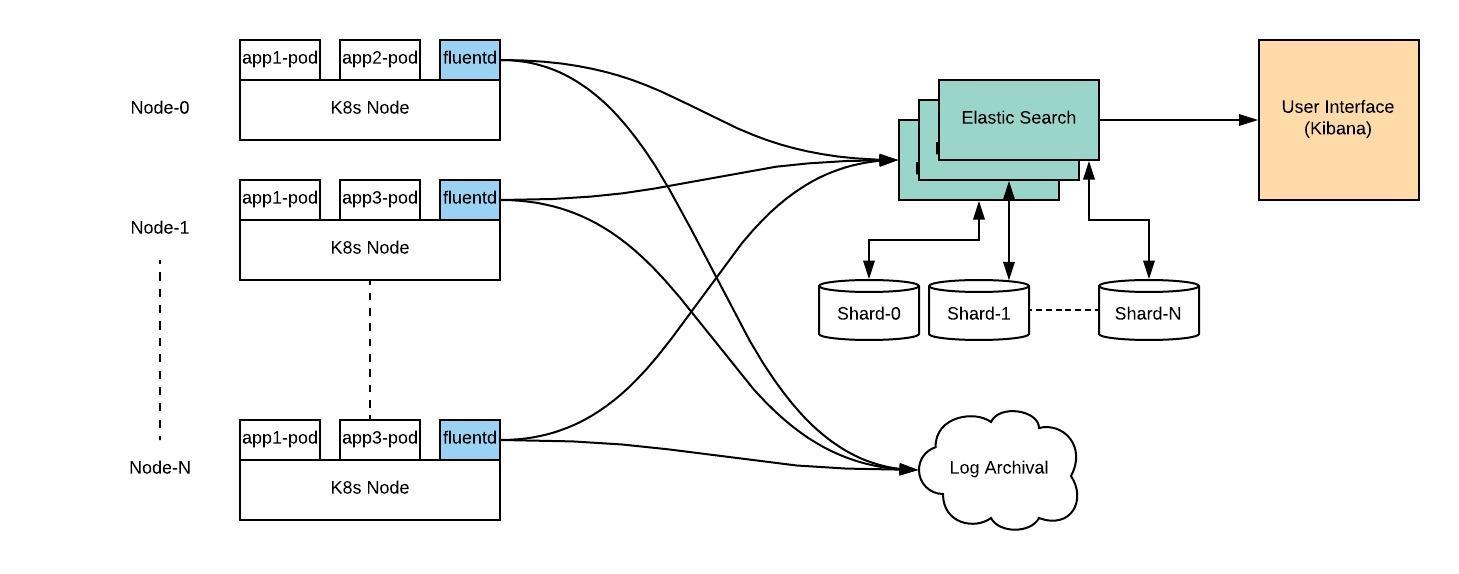
As seen above, the fluentd component runs as a daemonset on each node in Kubernetes cluster. As nodes are added/removed, kubernetes orchestration ensures that there is one fluentd pod running on each node. Fluentd is configured to run as a privileged container. It is able to collect logs from all pods on the node, convert them to a structured format and pass them to elasticsearch.
Elasticsearch component can be deployed as kubernetes, VM based application or a managed service. Kubernetes deployments use statefulset as the model. Each replica of statefulset keeps a shard of log data organized in a way so that it can tolerate node failures. The Kibana component is stateless and can be deployed as a simple deployment in kubernetes.
In addition, it is recommended to use log archival. This is a separate system like AWS S3, which can keep a backup of all logs in the system.
To summarize, we looked at the importance of log aggregation and query capabilities for K8s applications. In the follow-up articles, we will dive deeper and look at best practices and ‘how-to’ examples for deploying and using such a system.
This is a 3-part series on Kubernetes monitoring and logging. Continue to:
- EFK Stack – Part 1: Fluentd Architecture and Configuration
- EFK Stack – Part 2: Elasticsearch Configuration
Recommended Reading
Kubernetes Monitoring at Scale with Prometheus and Cortex
Author


