Cloud users often face network connectivity issues by failing to handle complicated network configuration details for OpenStack. This increases workload for support staff: they cannot help these users identify configuration problems without performing lengthy checks. To ease the pain, we developed an OpenStack network monitoring and troubleshooting tool for OpenStack Neutron. In addition to network connectivity issues, the tool identifies global network health based on network packet tracing. In this post, we aim to explain how this troubleshooting and monitoring tool was implemented and what it can achieve.
OpenStack Network Troubleshooting Tool for Neutron
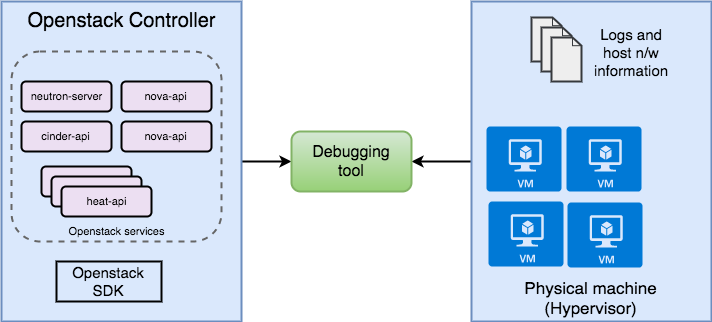
This tool for OpenStack Neutron can be run by either the cloud users or the support team. It can be run within the host reporting issues or outside the host. If the tool is run within the host, we can run an additional packet tracing check. The high level architecture of this tool is shown as below:

The debugging tool gathers necessary information from both Openstack controller and hosts. From the controller, standard OpenStack information will be queried via OpenStack SDK, and complementary information will be provided from a resource manager that keeps track of OpenStack nodes in the cloud. If this piece of tool is run outside the host, then information on hosts will be gathered by Platform9 support bundle, which is a collection of neutron agent logs and host networking information. Otherwise, we can read the information directly from the host.
With base configuration information from the controller, we can run a set of tests to see if the configuration is valid. We use an independent checker for each potential configuration issue, thus making sure the architecture is pluggable. Right now, this tool can be used to check for these invalid settings:
- Inactive Network Component – An administrator can disable any Neutron object by toggling the admin state. This is used primarily for maintenance.
- IP Plumbing – Any network component that sit in the data plane from an instance to the physical network interface card (NIC) can be misconfigured or un-configured causing traffic flow issues.
- Inconsistent Floating IPs – Floating IPs, like elastic IPs in AWS, are meant to move from one instance to another depending on usage. When a floating IP is switched over to another instance, Neutron is responsible for cleaning up the older configuration and adding new configuration. Cases when this does not occur cause north-south traffic connectivity problems.
When a new functionality needs to be checked, we can write new test cases easily by adding another Checker class in the source code.
We also added functionalities that check network connectivity via packet tracing. A troubleshooting tool may not cover all the potential invalid configurations, or at certain point, the user may still experience network connectivity issues even if the configuration is correct. Take for instance, a problem with the underlying networks. When this happens, it would be helpful to provide more information to the support team through the use of a packet tracing tool. This packet tracing works the same way as if we are doing ping test within the VM and set up probes with tcpdump on a network interface and see whether or not that network interface gets the ICMP request or reply. And this will help us identify where the packet is dropped, and narrow down our scope while searching for the network problem. With this tool, you do not need to log into VM to perform the test.
OpenStack Network Monitoring for Neutron
In addition to local networking issues, we may have interest in obtaining global network connectivity issues pertaining to all of Openstack based on the packet tracing method. Information about what is wrong with our OpenStack deployment as a whole , instead of identifying problems associated with a single VM, can be particularly useful in resolving scalability issues.
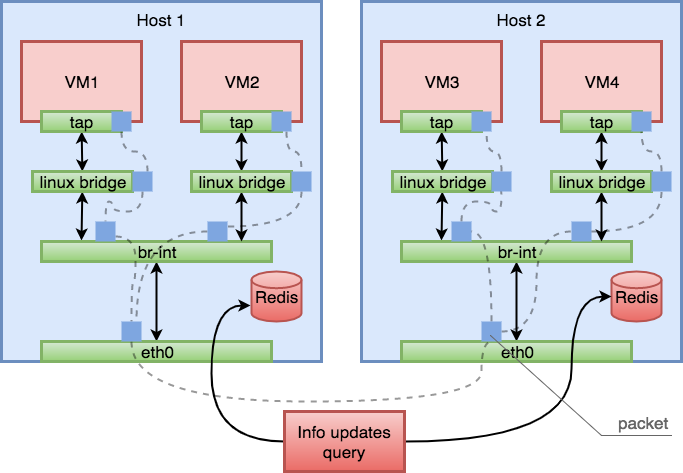
This architecture of this tool is shown as below:

We set up listener and packet generator in the same way as its counterpart in the troubleshooting tool. When using this with large number of VMs and hosts, the setup process can be automated using Ansible.
A Redis cluster sits between the controller and host. All the information (the VM, IP address, MAC address, etc.) is fed into Redis first, and results are stored in Redis. The sharded Redis cluster, with its in-memory storage, will improve the throughput, and help avoid bottlenecks in information distribution and result gathering.
A packet generator chooses two instances at random, both within the same tenant network and validates network connectivity between them by generating spoofed ICMP packets. Negative results (ping losses) of this exercise is stored in Redis. Cumulative information of lost packets helps us to deduce the issue in our network.
Next Steps
This troubleshooting tool increases debugging productivity and helps the support team quickly diagnose issues that otherwise would have taken a significant effort. Making debugging easier is an important step towards timely and effective network recovery. Reduced recovery turnaround-times in-turn contribute to increased product uptime. The work completed in this project can be used to build completely automated recovery from network failures (self-healing infrastructure). If you have any questions about Platform9 Managed OpenStack or this project, please start a discussion below.
—
This project was done by Lingnan Gao (Software Engineering Intern) under the guidance of Arun Sriraman during Summer 2017.


