
Kubernetes Monitoring Solutions
Deploying Prometheus on Kubernetes
Deploying Cortex on Kubernetes
Key Metrics ti Track
The growing adoption of microservices and distributed applications gave rise to the container revolution. Running on containers necessitated orchestration tooling, like Kubernetes.
But managing the availability, performance, and deployment of containers is not the only challenge. It is important to not only be able to deploy and manage these distributed applications, but also to monitor them. An observability strategy needs to be in place in order to keep track of all the dynamic components in a containerized microservices ecosystem. Such a strategy allows you to see whether your system is operating as expected, and to be alerted when it isn’t. You can then drill down for troubleshooting and incident investigation, and view trends over time.
Kubernetes can simplify the management of your containerized applications and services across different cloud services. It can be a double-edged sword, though, as it also adds complexity to your system by introducing a lot of new layers and abstractions, which translates to more components and services that need to be monitored. This makes Kubernetes observability even more critical.
There are a lot of open-source tools that can help you monitor your applications running in your Kubernetes cluster. In this post, we will talk about Prometheus and Cortex, and discuss how to configure them to monitor your Kubernetes applications and services, at scale. Although you can use Prometheus alone, we will discuss the advantages that Cortex brings. We’ll also cover how to leverage some of the automated deployment/install methods like Helm.
Kubernetes Monitoring Solutions:
 Prometheus
Prometheus is an open-source application used for metrics-based monitoring and alerting. It calls out to your application, pulls real-time metrics, compresses and stores them in a time-series database. It offers a powerful data model and a query language and can provide detailed and actionable metrics. Like Kubernetes, the Prometheus project has reached a mature “graduated” stage with CNCF.
Prometheus Limitations and Challenges
While Prometheus is a great solution for your monitoring needs, it is also purposely designed to be simple and versatile. It is meant to store all of its compressed metrics into a single host, in its own time-series database on disk. Prometheus is not designed for long-term storage (so you can keep data for a few weeks, but not for months or years), and the storage layer is not distributed (all the data is on one machine). Prometheus is great for alerting and short-term trends, but not for more historical data needs (i.e. for use cases such as capacity planning or billing – where historical data is important and you typically want to keep data for a long time).
Prometheus does not provide multi-tenancy; which means that it can scrape many targets, but has no concepts of different users, authorization, or keeping things “separate” between users accessing the metrics. Anyone with access to the query endpoint and web endpoints can see all the data. This is the same for capacity isolation. If one user or target sends too many metrics, it may break the Prometheus server for everyone. All of these factors limit its scalability, which can make running Prometheus in an enterprise environment challenging.
 Cortex
Cortex is an open source project that originated at Weaveworks that seeks to bridge these Prometheus scalability gaps. It is a “reimplementation” of Prometheus in the sense that it reimplements the storage and querying parts of Prometheus (but not the scraping parts) in a way that is horizontally scalable and durable (safe against data loss resulting from losing a single node). Cortex parallelizes the ingestion and storage of a Prometheus metric, and stores it across a distributed noSQL database. Out of the box, some of the long-term storage options that Cortex supports are: AWS DynamoDB, AWS S3, Apache Cassandra, Google Cloud Bigtable, and others. For users who want to run Cortex on-prem – Cassandra is currently the best choice for installations where a user wants to keep Cortex off of public cloud services. There are also some newer alternatives, and one could also setup a private S3 installation with Minio and use that instead of AWS S3.
A typical Cortex use case is to have a Prometheus instance running on your Kubernetes cluster, which scrapes all of your services and forwards them to a Cortex deployment using the Prometheus remote write API. Cortex then periodically bundles the samples and writes them to a distributed storage. It has multi-tenancy built in, which means that all Prometheus metrics that go through Cortex are associated with a tenant and offers a fully compatible API for making queries in Prometheus. Cortex also offers a multi-tenanted alert management and configuration service for re-implementing Prometheus recording rules and alerts. Instead of being config-file driven like Prometheus, the same config files are persisted via a REST API. You could use Grafana (or other similar tools) alerting capabilities on top of Cortex, as part of your stack.
Deploying Prometheus and Cortex on Kubernetes
Let’s deploy these monitoring tools onto Kubernetes and see it in action. When using Cortex, you still need a ‘normal’ Prometheus setup in order to scrape metrics and forward data to it.
Assuming that you have a Kubernetes cluster up and running with kubectl set up, we can use helm to make our lives easier in installing Prometheus components onto our cluster. Helm is a package manager for Kubernetes that collects sets of templatized Kubernetes manifest files into a unified bundle called a chart, which is organized and versioned. Once the Helm client deploys the chart into the Kubernetes cluster, it can manage the upgrade and rollback of these bundles.
 Installing Helm
First, install Helm, and then install Tiller (Helm’s server-side component) onto our cluster:
code>
$ helm init
Output:
code>
$HELM_HOME has been configured at /home/daisy/.helm.
Tiller (the Helm server-side component) has been installed into your Kubernetes Cluster.
Note: By default, Tiller is deployed with an insecure ‘allow unauthenticated users’ policy. To prevent this, run helm init with the –tiller-tls-verify flag.
For more information on securing your installation see here. Happy Helming!
Check that Tiller has been installed by typing:
code>
$ helm version
Output:
code>
Client: &version.Version{SemVer:"v2.12.3", GitCommit:"eecf22f77df5f65c823aacd2dbd30ae6c65f186e", GitTreeState:"clean"}
Error: could not find a ready tiller pod
If you see this output, this is because the Helm permission model requires us to adjust its default setup so that it can work with the permission structure in Kubernetes, which has RBAC turned on by default. As a result, the service account for each namespace does not have cluster-wide access out-of-the-box, so Tiller (running as a pod in the system-wide kube-system namespace) does not have permission to install and manage cluster resources.
To work around this issue, we can elevate permissions for the default service account in the kube-system namespace to be cluster-wide:
$ kubectl create clusterrolebinding add-on-cluster-admin --clusterrole=cluster-admin --serviceaccount=kube-system:default
Note: This is fine for exploring Helm, but you will want a more secure configuration for a production-grade Kubernetes cluster. Consult the official Helm RBAC documentation for more information on securing a Tiller installation.
Type “helm version” again and we should see:
Client: &version.Version{SemVer:"v2.12.3", GitCommit:"eecf22f77df5f65c823aacd2dbd30ae6c65f186e", GitTreeState:"clean"}
Server: &version.Version{SemVer:"v2.12.3", GitCommit:"eecf22f77df5f65c823aacd2dbd30ae6c65f186e", GitTreeState:"clean"}
 Deploying Prometheus
Now we need to deploy Prometheus onto our cluster. This entails running the Prometheus server in a pod (by using a deployment to ensure that it keeps running), exposing the Prometheus server web UI (by using a NodePort), running the node exporter on each node (using Daemon sets), setting up a service account so that Prometheus can query the Kubernetes API, and configuring the Prometheus server (and storing the configuration in a Config Map).
Helm will take care of all of these steps for us! In your terminal, type:
$ helm upgrade prometheus stable/prometheus \
            --install \
            --namespace monitoring \
            --set server.service.type=NodePort \
            --set server.service.nodePort=30090 \
            --set server.persistentVolume.enabled=false
This will upgrade the “prometheus” release to the latest version from the stable/prometheus Helm chart, and install it if it doesn’t exist. We are also putting the Prometheus components into a separate monitoring namespace and specifying some values to be set when rendering the charts. In particular, we are exposing the server with a NodePort. A NodePort is a service type that is made available on all of our nodes and can be connected to externally. By default, the allocated ports are in the range 30000-32768.
Check the status of your pods by typing:
$ kubectl get pods -n monitoring
Output:
NAME                                                                             READY   STATUS RESTARTS   AGE
prometheus-alertmanager-5df865b5d7-m6c25           2/2           Running   0                 20m
prometheus-kube-state-metrics-88648b885-ppz6c    1/1           Running   0                   20m
prometheus-node-exporter-zscn5                         1/1            Running   0                20m
prometheus-pushgateway-58fb574d-tcfqb                  1/1            Running   0                20m
prometheus-server-8bb84ddc-snjzp                       2/2            Running   0                20m
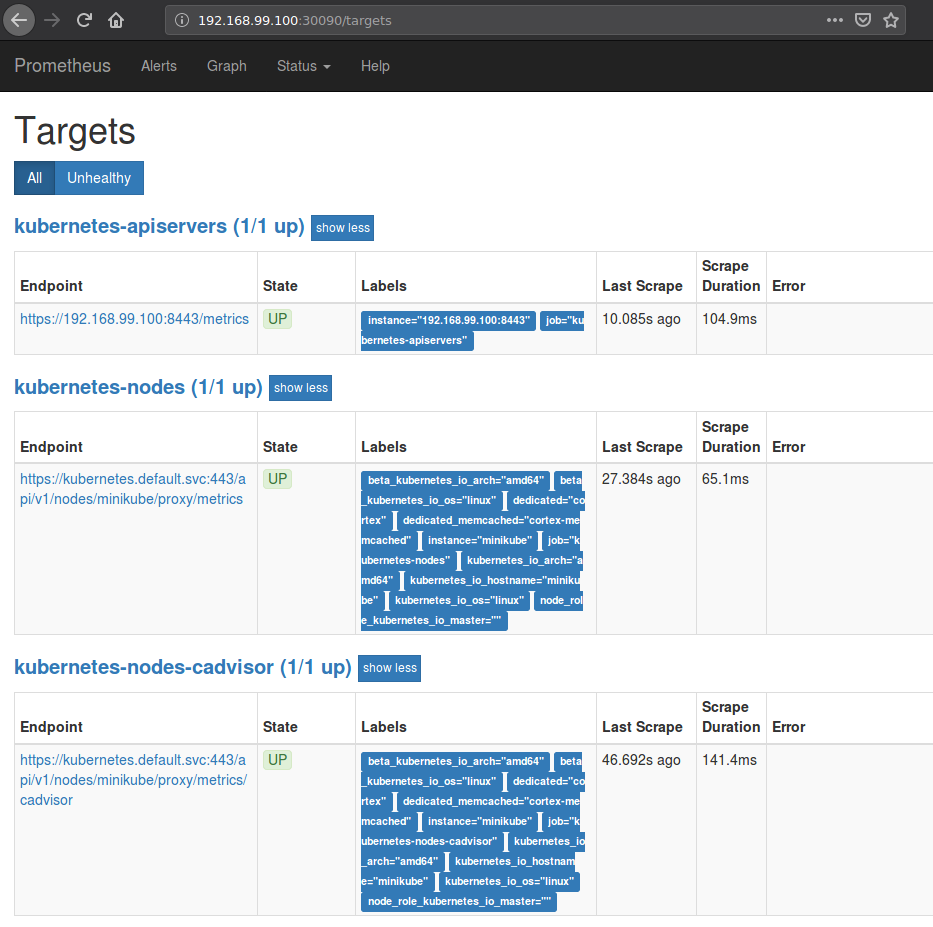
Let’s get the details for the NodePort that has been allocated to the Prometheus server so that we can connect to the Prometheus web UI:
$ kubectl get services --all-namespaces | grep prometheus-server

monitoring  prometheus-server           NodePort    10.104.39.225       80:30090/TCP            47m
Using the IP address of your running cluster, connect to the mapped port specified with your browser:
Now you can query for some metrics with PromQL. Click on the “Graph” tab and in the Expression input box, type “container_cpu_usage_seconds_total” to view CPU usage across all containers.
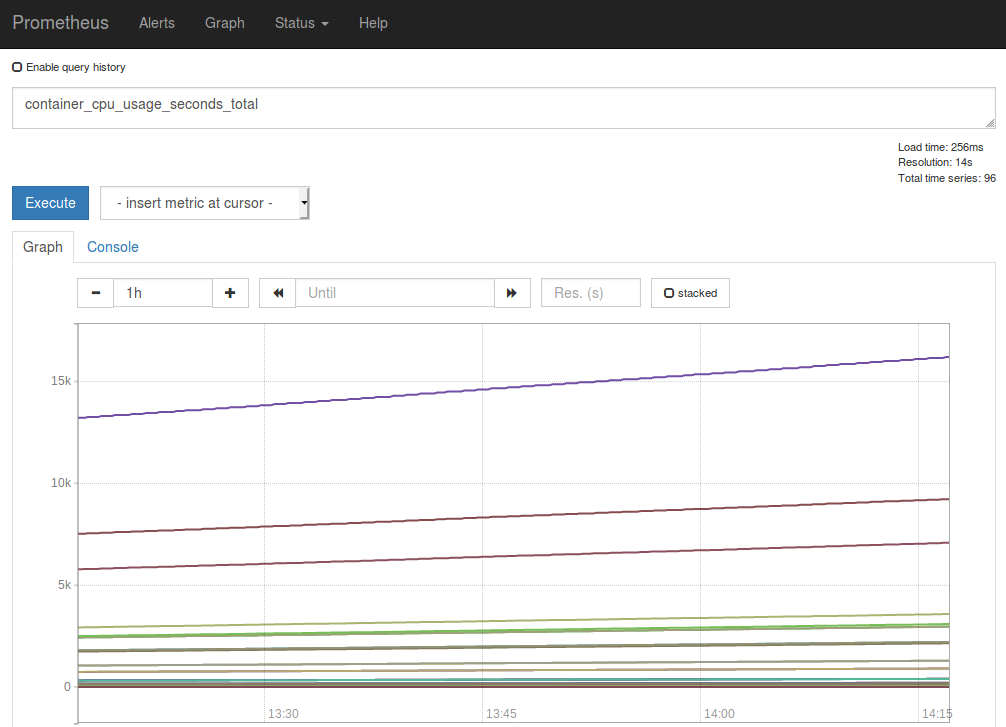
We will go over other metrics we should pay attention to later on.
 Deploying Cortex
Let’s move onto installing Cortex onto our cluster. Cortex has conveniently provided a Helm chart that can be found here. Download the chart, configure it to your liking, package it up with “helm package”, and install it like this:
$ helm install --name cortex --namespace cortex
If you would like to override some default values:
$ helm install --name cortex --namespace cortex -f my-cortex-values.yaml
Make sure that you have sufficient CPU and memory resources on your cluster before installing this chart since there are varying resource requirements for the different components. In addition, the default chart settings specify that Cortex pods have node affinity for nodes with the label “dedicated=cortex”, and memcached pods have affinity for nodes marked with “dedicated=cortex-memcached”.
To label your nodes following this requirement, type:
$ kubectl label nodes  dedicated=cortex
$ kubectl label nodes  dedicated=cortex-memcached
There are also a few manual steps required in order to install the chart, specified in more detail here. You will need to create a secret “cortex-aws-creds” with credentials to your cloud storage account:
$ kubectl -n {{ .Release.Namespace }} create secret generic cortex-aws-creds \
   --from-literal=USER_NAME= \
   --from-literal=USER_PASSWORD= \
   --from-literal=AWS_DEFAULT_REGION=
To verify that Cortex is installed correctly, port forward to an nginx Pod like this:
$ kubectl -n {{ .Release.Namespace }} port-forward $(kubectl -n {{ .Release.Namespace }} get pods -l "cortex=nginx" -o jsonpath='{.items[0].metadata.name}') 8080:80
You should now be able to visit the Prometheus API, which should show a bunch of metrics being collected: http://127.0.0.1:8080/api/prom/api/v1/query?query=up
Key metrics to track
Kubernetes introduces several abstractions in its ecosystem, which translates to new considerations when it comes to choosing which metrics to track. They can be separated into two main categories: monitoring the health of the cluster and monitoring the pods which hold the containers running the services and applications.
There are two types of resources that can be consumed by containers: CPU and RAM. The USE/RED method is a good guideline to follow when tracking metrics in production and states that you should track the utilization, saturation, and error rates for all of your resources. For an excellent explanation of the four golden signals (latency, traffic, errors, saturation), please refer to this chapter of the Google SRE book.
Generally speaking, you should be collecting metrics from your cluster infrastructure, container metrics, and application-specific metrics. Prometheus was built primarily for the third use-case, but the ecosystem around it quickly evolved so it is well suited for all of the above.
There are application-specific metrics that will vary and depend on functionality. These should be custom-instrumented, but will typically export metrics such as number of HTTP requests and its latency and error rate, number of outgoing connections, number of threads, etc.
Conclusion
Kubernetes introduces a lot of new layers that need to be taken into account when crafting out an observability strategy. While Prometheus is a great monitoring tool to use with Kubernetes, it was purposely designed to be simple and not built for long term storage out of the box. When it comes to creating a scalable and durable monitoring solution, it is useful to turn to tools like Cortex (which extends Prometheus) and leverage its distributed long term storage features and built-in multi-tenancy.
To learn more about Kubernetes observability, and to set up Fluentd for log aggregation, see this article on the EFK stack.
Prometheus Kubernetes
Prometheus is the top open source tool for Kubernetes monitoring, but it’s difficult to use in the enterprise environments. Learn how to easily deploy and run Prometheus monitoring with an automated, fully managed service.
Learn More About Kubernetes Monitoring & Logging
In the old world of servers and virtual machines, people were used to monitoring monolithic applications, where they would look at services on an individual server. As you refactor those applications into microservices in a Kubernetes world, you have to take a different mindset into how you setup Kubernetes monitoring and logging and how you keep an eye on those various services.
Our additional articles below can help you learn more about best practices, tools, and hands-on tutorials for Kubernetes monitoring & logging.
Demystifying Kubernetes Monitoring
Monitoring up-time for applications changes. With Kubernetes you’re no longer concerned about whether or not your application is constantly up and running at the infrastructure level, but rather, you’re monitoring at the application level.
Read more: Demystifying Kubernetes Monitoring
Observability in Kubernetes Environments
There are many tools in the cloud-native and microservices tool chest. Kubernetes is the go-to for container management, giving organizations superpowers for running container applications at scale. However, running an enterprise-grade, production-level Kubernetes deployment is more than running just Kubernetes by itself.
Read more: Observability in Kubernetes Environments
Logging & Monitoring of Kubernetes Applications: Requirements & Recommended Toolset
For a production-grade Kubernetes cluster, monitoring, alerting and log aggregation are essential. In this article, we are going to focus on why is it necessary and the requirements for a production-grade logging system.
Read more: Logging & Monitoring of Kubernetes Applications: Requirements & Recommended Toolset
Kubernetes Logging and Monitoring: The Elasticsearch, Fluentd, and Kibana (EFK) Stack – Part 1: Fluentd Architecture and Configuration
Fluentd scraps logs from a given set of sources, processes them (converting into a structured data format) and then forwards them to other services like Elasticsearch, object storage etc. Fluentd is especially flexible when it comes to integrations – it works with 300+ log storage and analytic services.
In this article, we’ll dive deeper into best practices and configuration of fluentd.
Kubernetes Logging and Monitoring: The Elasticsearch, Fluentd, and Kibana (EFK) Stack – Part 2: Elasticsearch Configuration
Elasticsearch is a robust search engine and document store. Kibana is the UI companion of Elasticsearch, simplifying visualization and querying. But it is the most complex piece in our EFK stack for Kubernetes log aggregation and monitoring solution.
In this article, we’ll dive deeper into best practices and configuration of Elasticsearch.
How has Kubernetes Transformed Monitoring
Kubernetes simplifies critical aspects of application availability through container self-healing, auto-scaling, and automated deployments. However, the many layers of abstraction and the proliferation of container services make it impossible to manually troubleshoot when things don’t work as expected. This means observability has become more critical than ever and presents a different world than that of traditional APM and virtual machine management.
Watch the webinar: How has Kubernetes Transformed Monitoring
Tackling Observability in Your Kubernetes Environment
Observability in container-based environments requires a re-think of the monitoring tools you use in production. This tech brief presents a natural progression of how teams start with observability and become more fluent in using observability tooling.
Read more: Tackling Observability in Your Kubernetes Environment
Monitoring Strategies for Kubernetes
Kubernetes is a complicated beast in many respects, and monitoring is no exception. Although in some ways the monitoring tooling and strategies that teams already have in place can be extended to support Kubernetes, in other ways Kubernetes requires you to forget everything you think you know about how APM is supposed to work.
Read more: Monitoring Strategies for Kubernetes
Kubernetes Logging Best Practices
When dealing with a large pool of containerized applications and workloads in Kubernetes, it is important to be proactive with monitoring and debugging errors. These errors are seen at the container, node, or cluster level. Kubernetes’ logging mechanism is a crucial element to manage and monitor services and infrastructure. In the case of Kubernetes, logs allow you to track errors and even to fine-tune the performance of containers that host applications.
Read more: Kubernetes Logging Best Practices

