
Kubernetes is a complicated beast in many respects, and monitoring is no exception. Although in some ways the monitoring tooling and strategies that teams already have in place can be extended to support Kubernetes, in other ways Kubernetes requires you to forget everything you think you know about how APM is supposed to work.
To help guide practitioners in developing effective monitoring strategies for Kubernetes, Platform9 offered a webinar featuring Chris Jones, Product Manager for Managed OpenStack & Kubernetes at Platform9. Over the course of his more than ten years of experience in the software industry, Jones has lived through a series of major transformations: The appearance of “modern” APM tools like New Relic and AppDynamics, the rise of virtual machines, the advent of the cloud and, most recently, the widespread adoption of containers and Kubernetes.
At the same time, Jones’s experience helping to develop Platform9’s managed Kubernetes offering gives him special insight into the availability and performance demands that companies must meet today when rolling out Kubernetes.
Throughout the webinar, which was moderated by Platform9 Product Marketer Kamesh Pemmaraju, Jones drew on his expertise to offer critical guidance to organizations planning a Kubernetes monitoring strategy (or optimizing one they already have in place). Following are highlights from his presentation.
Understanding the audience
The webinar began with a quick survey of attendees to determine where they currently stand in their Kubernetes journeys and what their monitoring needs entail.
While a majority of respondents — 43 percent — said they were “just getting started” with Kubernetes, the rest were either using Kubernetes in development and testing, or already in production.
A strong majority of respondents — 86 percent — are or are planning to run Kubernetes in the public cloud. Half also said they would run it on-premises, however, and 22 percent indicated plans to run it on the edge.
When it comes to existing monitoring tools, a full 93 percent of respondents are relying on open source metrics solutions like Prometheus. Thirty-six percent also use open source logging tools, like ELK or Loki. Surprisingly, only a small number — 15 percent and 8 percent, respectively — use traditional APM or infrastructure monitoring tools.
Summary of content
From there, Jones moved into a discussion of how monitoring has shifted over the past 15 years or so.
VMs didn’t revolutionize applications…
Jones started by observing that, although the widespread adoption of VMware and other VM platforms revolutionized the way infrastructure was built (and therefore monitored), it did little to change applications.
The VM revolution added some new infrastructure metrics to monitor, but “overall we stayed the same,” Jones said.
…And neither did cloud
After VMs, came the cloud — PaaS and IaaS. These trends, too, added more metrics, while also adding complexity to the overall environments in which they ran. Still, however, application architectures remained fundamentally the same.
Then came containers
Things finally changed on the application front with the introduction of modern container platforms, namely Docker in 2013. Containers led to stateless applications that are smaller in size individually, but ten times more numerous within environments.
At the same time, containerized infrastructure is more transient — meaning applications move between host servers constantly — as well as more scalable and denser.
In addition, because of containers’ portability, they have encouraged adoption of multi-cloud strategies, adding even more complexity to environments.
The end result is this: Applications over the past half-decade have grown significantly more complicated — so complicated, in fact, that you can’t simply extend the monitoring strategy that worked for VMs and expect it to work for containers, too.
Kubernetes adds even more complexity
The rise of Kubernetes brought even more complexity to application monitoring. The main reason is that Kubernetes adds another multi-component layer to software environments that must be monitored. You must keep track of the health of your cluster, pods, containers, storage and networking components within the cluster.
Of course, you still have to monitor the applications and the underlying infrastructure.
This all adds up to the following, Jones said: “In the world of Kubernetes, a lot can break.”Your app can break due to memory leaks, load balancing problems, poorly written methods and so on. Kubernetes itself can crash. And your underlying infrastructure — whether it is a physical server, VM or cloud — can fail, too.
To stay ahead of these issues requires a comprehensive monitoring regime that addresses all layers of a containerized, Kubernetes-based environment.
How to monitor today
Jones suggested that organizations can meet this challenge by taking a three-tiered approach to Kubernetes monitoring:
- Monitor your infrastructure: Collect metrics about infrastructure availability, virtualization contention, capacity and performance.
- Check your logs: You can’t do everything with logs (they’re not useful for real-time monitoring, for example), but they are an important source of visibility into containerized software stacks, especially because they can help you follow what happened in transient infrastructure.
- Use APM: APM tools, too, won’t solve all your Kubernetes monitoring challenges. But they can help you to determine where issues exist, who the issues impact and what the root cause is.
Kubernetes monitoring best practices
Jones also identified three key pillars to adopt in order to monitor Kubernetes most effectively:
- Need a dedicated team: First, make sure you have a team that “owns” Kubernetes monitoring. Even if that is not their sole responsibility, it needs to be clear who should be monitoring the cluster (or clusters), and who responds when something goes wrong.
- Be user-focused, not CPU-focused: Your end-goal in monitoring should always be to keep users happy, not keep computers happy. Granted, happy computers typically lead to happy users, but remember that user satisfaction is the end-goal.
- Integrate your tools: Because Kubernetes monitoring involves so many layers, you can’t try to collect or analyze all of your metrics with just one tool. You’ll instead need a series of tools, which should integrate well with each other to give you full visibility.
How Platform9 helps you monitor Kubernetes
As Jones explained, Platform9 helps users of its managed Kubernetes service to monitor their clusters in two key ways.
Self-service Kubernetes monitoring
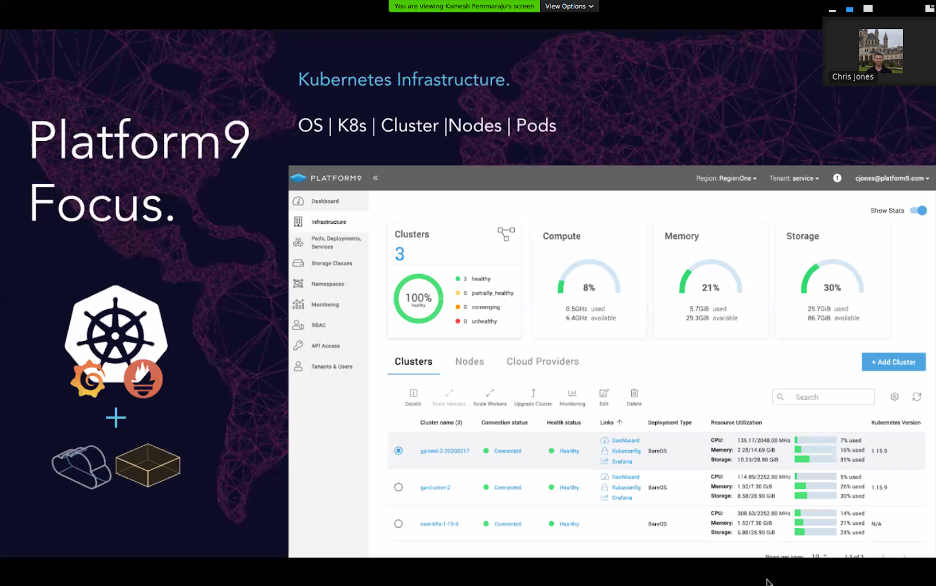
First, Platform9 offers easy, self-service access to monitoring data. Platform9 collects the data automatically for you. You can view that data anytime by opening the Grafana dashboard that is built into the Platform9 Web UI. Simply click the “Grafana” link for the relevant cluster:
In addition, the Platform UI offers an Alarm overview, where you can keep track of alerts:
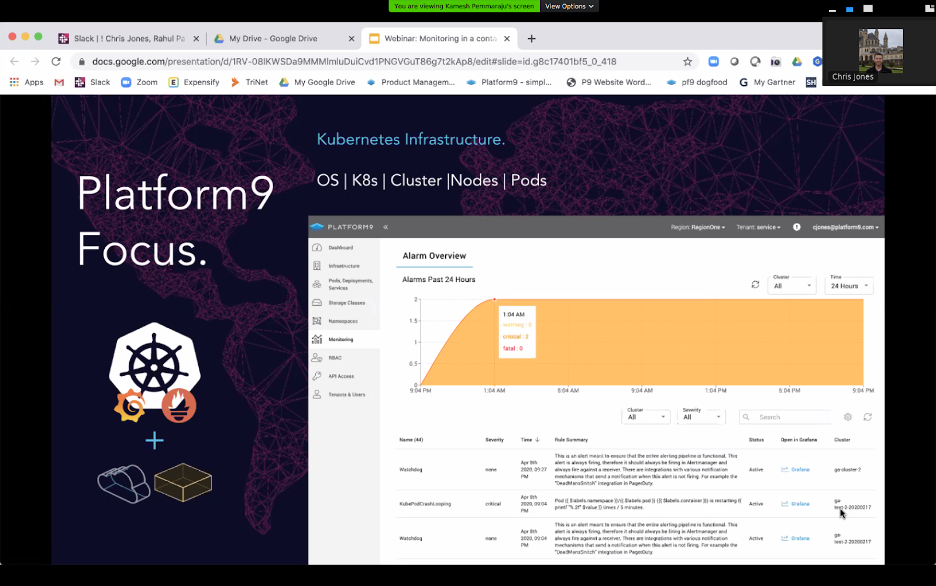
The Alarm tool is being actively developed, with new features coming soon, Jones said.
Platform9’s internal Kubernetes monitoring
Although Platform9 makes it easy for you to monitor your Kubernetes clusters yourself, it doesn’t expect you to handle monitoring on your own. After all, Platform9 offers a managed Kubernetes service, which is designed to simplify management from the user’s end.
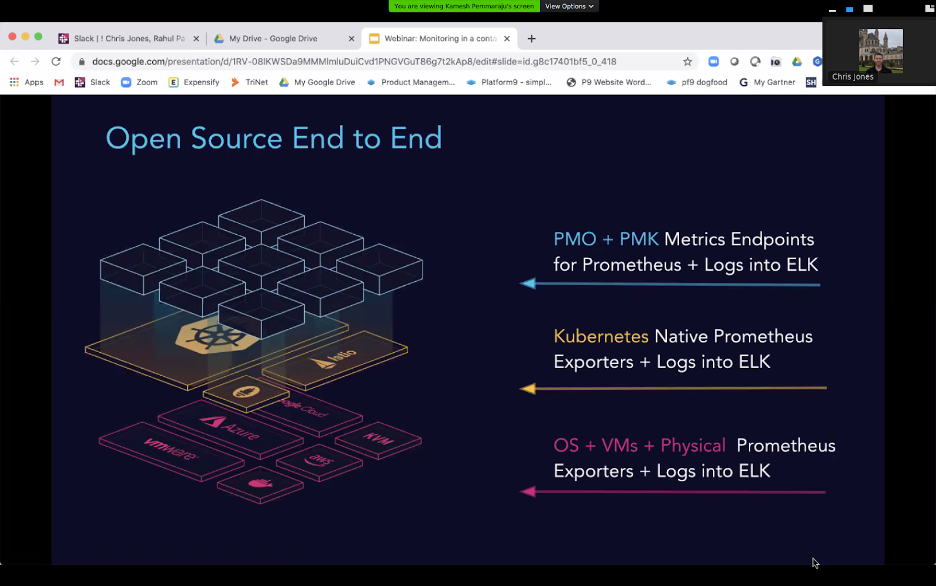
That’s why Platform9 internally monitors your Kubernetes clusters using Prometheus, ELK and Cortex. (If you’re wondering why Platform9 chose these tools, it’s because the company is committed to being “open source by design,” Jones said.)
If Platform9 identifies a problem based on the data it collects about your cluster, you’ll be notified.
In short, Platform9 offers the best of both worlds: The ability to dive deep into your monitoring data yourself, if you want to, via Grafana, while also taking a more hands-off approach and letting Platform9 do the monitoring work for you if you wish.
Another benefit of Platform9’s internal monitoring stack, Jones pointed out, is that it works with clusters that run anywhere — on-premises or in any public cloud. This means you can run Kubernetes in whichever way works best for you while still benefiting from Platform9’s monitoring service.
Audience questions
Jones had time to take a few audience questions following his presentation.
One involved which metrics are the most important to collect. Here, Jones said, “the more metrics, the merrier.” You’ll never know which metrics are most important until you are facing a problem that requires you to have a particular kind of metric. For that reason, you should seek to collect as many metrics as you possibly can.
That said, Jones pointed out that the amount of monitoring data you can store is probably limited. So you do need to be strategic about which metrics you collect. Think about which types of problems you are most likely to face, and which types of systems you run. If you have a lot of stateful applications, for instance, then metrics related to Kubernetes storage are more important than they are if you are running mostly stateless containers.
An audience member also asked about how to integrate Platform9 with existing logging systems. Jones pointed out that, while Platform9 is not itself a log management tool, you can deploy agents in Kubernetes that will allow you to integrate log data from a Platform9-managed cluster into any external logging platform you use. Thus, you’re by no means limited to the monitoring data available through Grafana directly from Platform9; you can use any and all external monitoring or logging tools you like.
Along similar lines, Jones responded to a similar question about avoiding situations where monitoring applications deployed within a Kubernetes cluster consume a large amount of CPU and, therefore, undercut cluster performance. Jones said that the best way to avoid this issue is to run your monitoring tool externally and deploy just an agent inside your cluster to collect data. But he also pointed out that the Platform9 team is always available to help if you are facing trouble deploying monitoring applications in an efficient way.
See for yourself
To view the full webinar yourself for free, click here.

