
One of the greatest strengths of FinOps is its ability to focus on driving business value. However, many teams, especially engineering teams, struggle to directly connect their work and their use of cloud services to the associated business outcome.
When cloud financial management was in its infancy (circa 2015) the driving focus was the price associated with IaaS services, the cost of a virtual machine, storage and networking in the public cloud. CIOs would push cloud first and lift-and-shift strategies that would result in sticker shock. I remember vividly in 2019, whilst presenting at the Toronto leg of the Microsoft Ignite tour, a director of databases remarking how their SQL Server instance was costing $18,000 per month! You know what happened next.
No association to a business metric was required. A simple comparison to the “on-prem” budget highlighted the need to reverse course.But what happens when you’re 100% cloud, or a born in the cloud business? How do you track, manage, compare, contrast and show the ROI of your cloud spend to the business? A great approach to intrinsically link your cloud spend to business value is Earned Value Management. Yes, the 40-year-old project management technique created by NASA and the US Military.
In the example below, I show how a UX change made by AustPac Airlines could un-intentionally blow-up costs. (Real example, but made up airline.)

The Business Value portion of the FinOps framework is where we will focus. Earned Value Management provides a contextual, near real-time view, into Budgeting, Forecasting and Benchmarking whilst implementing Unit Economics.

The outcome of Earned Value Management is an immediate view for all teams, including engineering, into the cost of cloud and [sales, support tickets, manufacturing, inference, deliveries] – Pick what works for your business.
The example below is an expansion on what was shared in a webcast with Anderson Oliveira (who is championing this approach). You can watch the replay.

Earned Value Management: AustPac Airlines Case Study
NOTE: All data in this analysis is fictitious and was not created with any involvement of AustPac Airlines, its employees, subsidiaries or contractors.
AustPac Airlines is an airline and sell seats (amongst other items) on flights. An obvious choice for a Unit Economic measure would be to use per seat sold, or cost per flight flown. For most seat sales a customer buys a ticket online, using their credit card and pays for their ticket and seat selection. I imagine the backend costs might include the usage of the following APIs and Services:
- API for flights, including Partner and Codeshare airlines.
- API for Frequent Flyer program and associated identity authentication.
- Seat Selection service.
- Payment gateway service.
- Flight credit API
- Ticketing service.
- Integration with US and International passenger manifest sharing
I hypothesize that a typical sale/transaction should use each and all of those services one to three times as a user attempts to locate the best seats on their preferred flight times.
Now what happens when a user experience (UI) change is made at the checkout step?
As a regular patron of Air New Zeeland, I was recently applying a flight credit and using a credit card for the remaining charges to secure two seats. The final step was on a checkout page that was new to me. Ultimately this new checkout page resulted in multiple checkout attempts in which all but one failed. After my final attempt that was successful in charging my credit card and taking my flight credits, I needed to call the service center as the ticket failed to ticket. What had I missed, after my final attempts I noticed I needed to hit ‘Apply on the credit card I had entered, not continue to click the “Pay Now” button.
Not knowing the issue, I repeated the entire process, hitting each API and Service multiple times and ultimately called someone. That’s a very expensive seat.
To explore the potential costs of this we need to apply some fictitious math.
Calculate a per unit (seat sold) target cost:
- Total Seats Per Month: 17010
- (Boeing 787-9 with 285 seats, 2 flights per day)
- Yearly Budget for Sales Portal: $14,400 (Per Month $1200)
- Target Cost Per Seat: $0.0705
Calculate monthly cost per seat sold:
If the actual spend on cloud resources is $1100, and the number of seats sold is 17000 then for that month ($1100/17000) the per unit measure is $0.064
What happens though if you sell 16,989 seats and spend 1100? = $0.0647
And then in the next month sell 16,960 seats and spend 1199? = $ 0.0706
And then, you sell 17,010 seats and spend 1400? = $0.0823
The table below shows each month’s unit cost, budget obtainment and number of seats sold.
| Month | Unit Cost | Budget Obtainment | % Of Seats Sold |
| Jan | $0.0705 | On Target | 100% |
| Feb | $0.0647 | Below Target | 99.8% |
| March | $ 0.0706 | Below Target | 99.7% |
| April | $0.0823 | Over Target | 100% |
April shows the budget was missed and this is most likely unexpected especially if no engineering changes were made. As there are sure to be some perplexed manager, engineering and ops may explain the increase as a result from a shift in the months Spot Instance prices. To communicate this, they may dig into a tool like Spot Ocean to investigate and hope it shows some change in Spot Instance pricing and some automation applied by Spot Ocean that secured the best price and caused minimal interruption.
If you’re tracking spend against your budget, what you will see is an increase in spend for April and May, but you would likely assess that nothing is off.
As time continues the numbers continue to show budget obtainment and some over runs. However, in September sales return to project targets (99%) and your per unit cost explodes! Hitting $0.094 vs expected $0.0705
| Month | Unit Cost | Budget Obtainment | % Of Seats Sold |
| Jan | $0.0705 | On Target | 100% |
| Feb | $0.0647 | Below Target | 99.8% |
| March | $ 0.0706 | Below Target | 99.7% |
| April | $0.0823 | Over Target | 100% |
| May | $0.075 | Over Target | 99.9 |
| June | $0.075 | On Target | 97.0% |
| July | $0.077 | On Target | 75.2% |
| August | $0.084 | Over Target | 82.3% |
| September | $0.094 | Over Target | 99.4% |
By using a per unit economic approach, you have seen a change in your cost measured as per seat sold.
Looking at the data from August you see sales started climbing and your budget exceeded. Time to investigate what was changed and to again dig into the spot instance prices in Spot Ocean.
The issue, the UX change in May, will most likely not be identified as the root cause and much effort will be spent.
What can be done, and how does Earned Value Management Help?
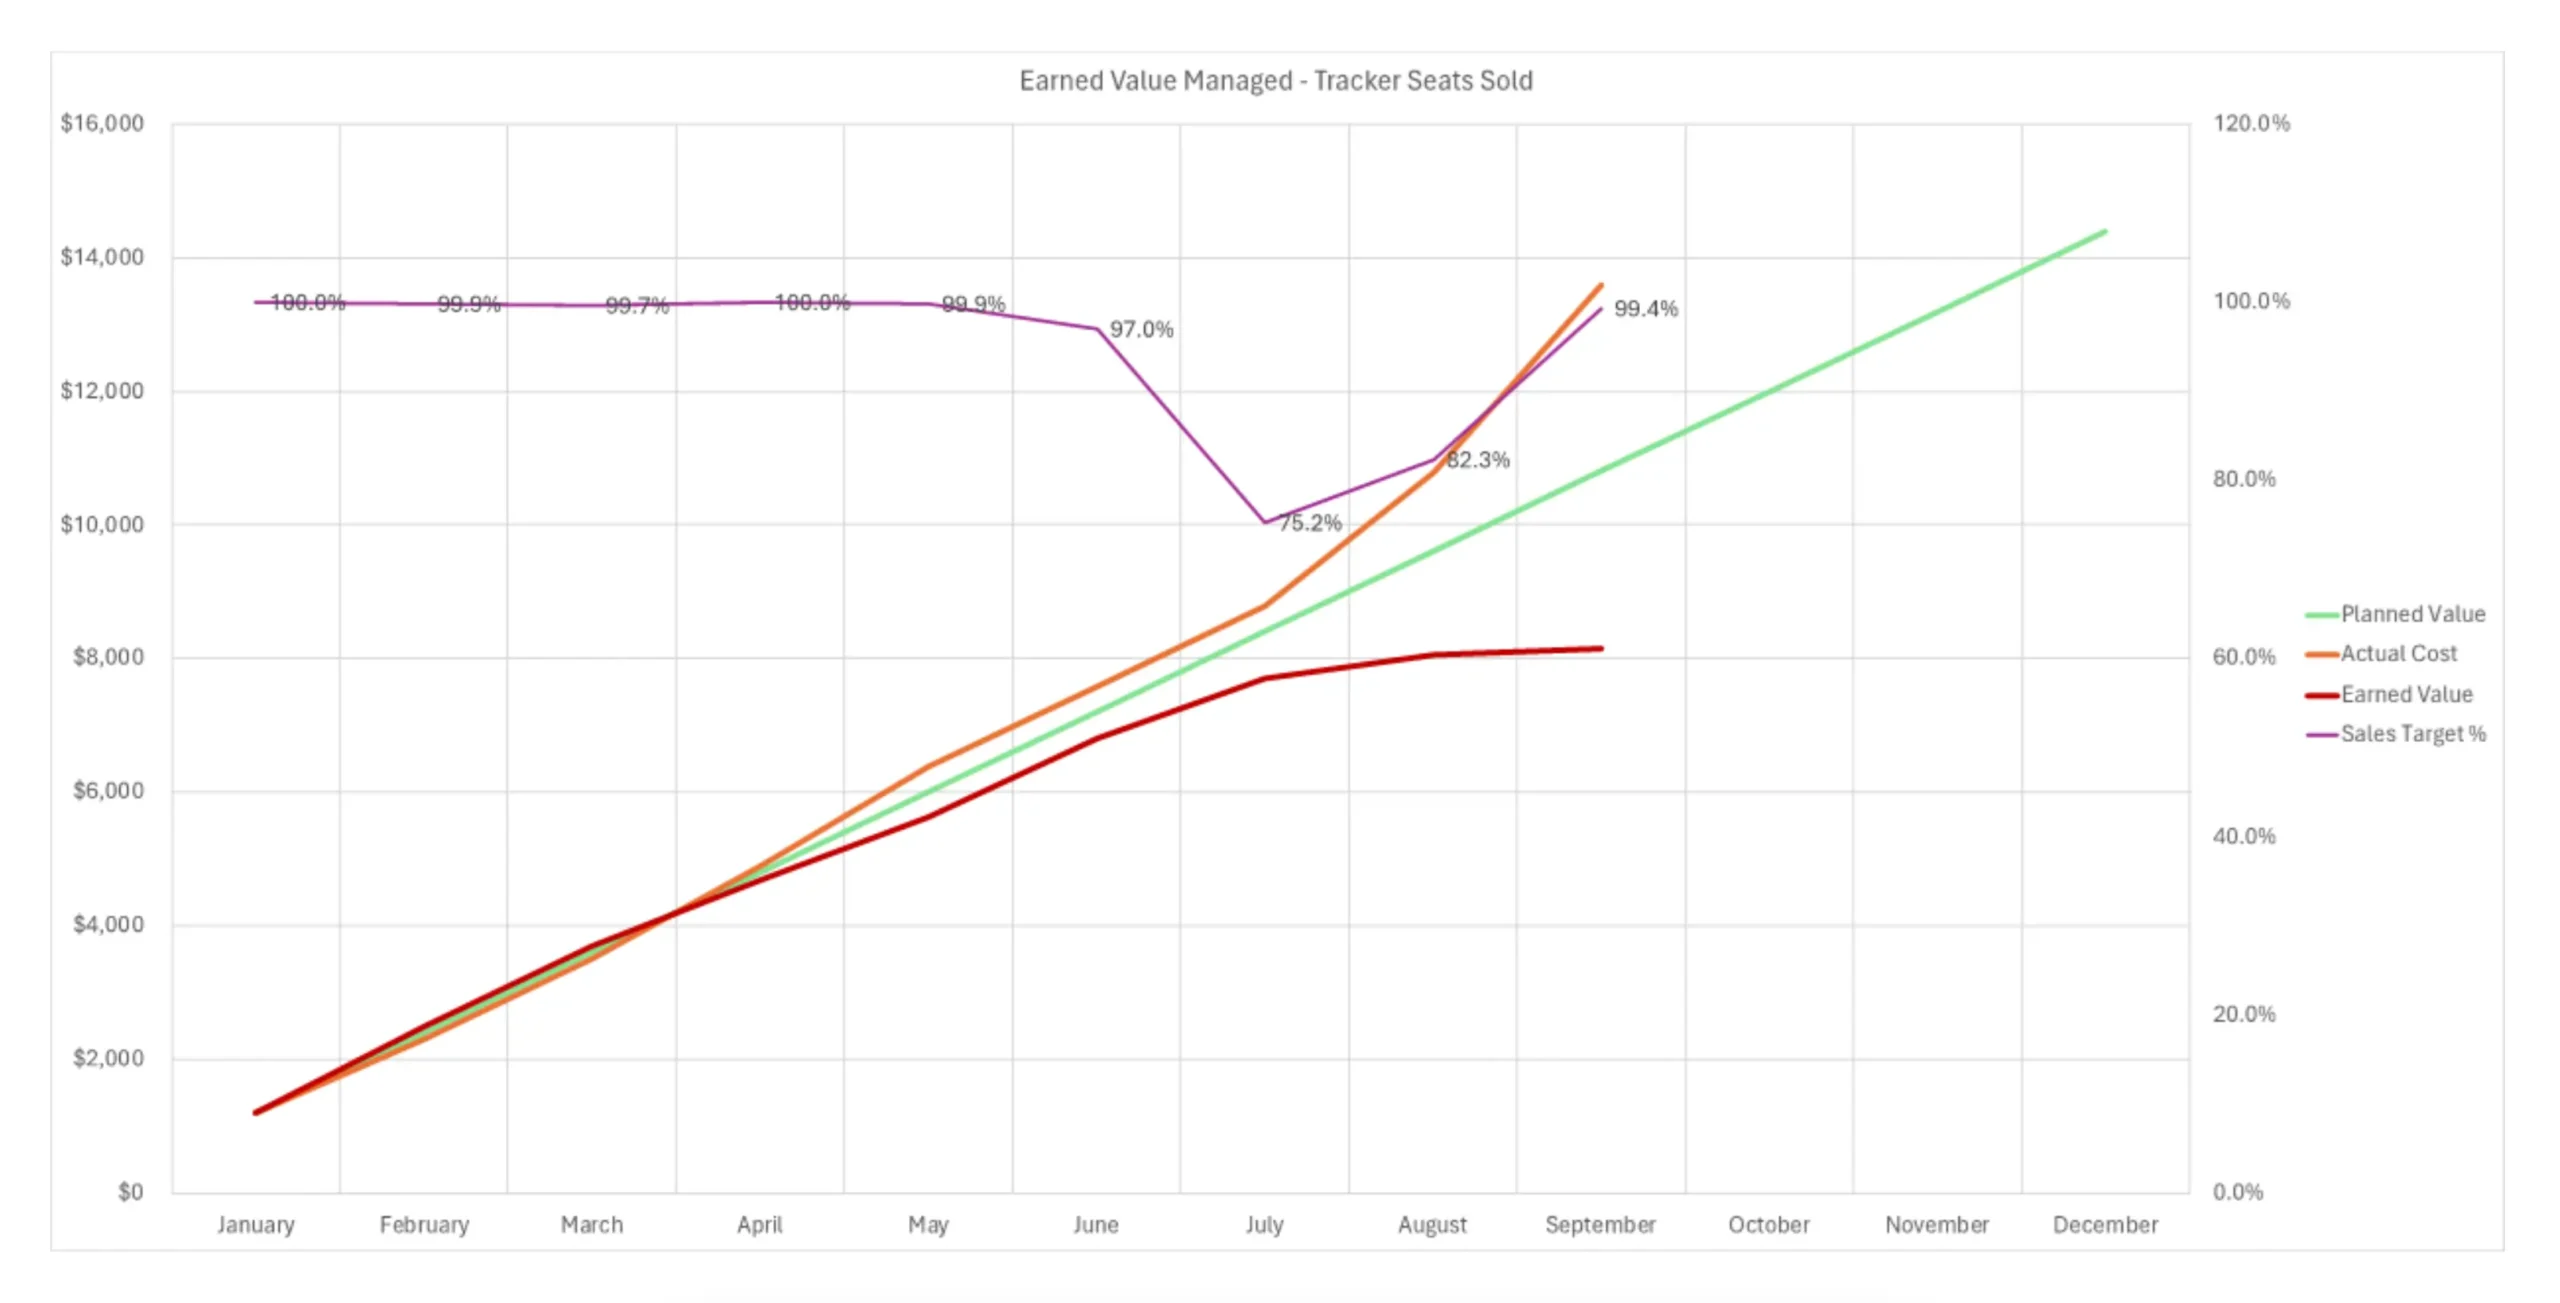
First, by Applying Earned Value Management you could visualize the change in real time. Below is a chart, plotting Earned Value Management measures from January to September.
To help highlight the benefit of Earned Value Management I included the obtainment of the monthly Sales Target as a percent. By including the sales obtainment, you can clearly see that the numbers were trending negative before the drop in sales. The drop in sales masked the problem, as the 21.8% drop in sales did not have the corresponding reduction in cloud spend, in fact, the cost variance worsened in July.
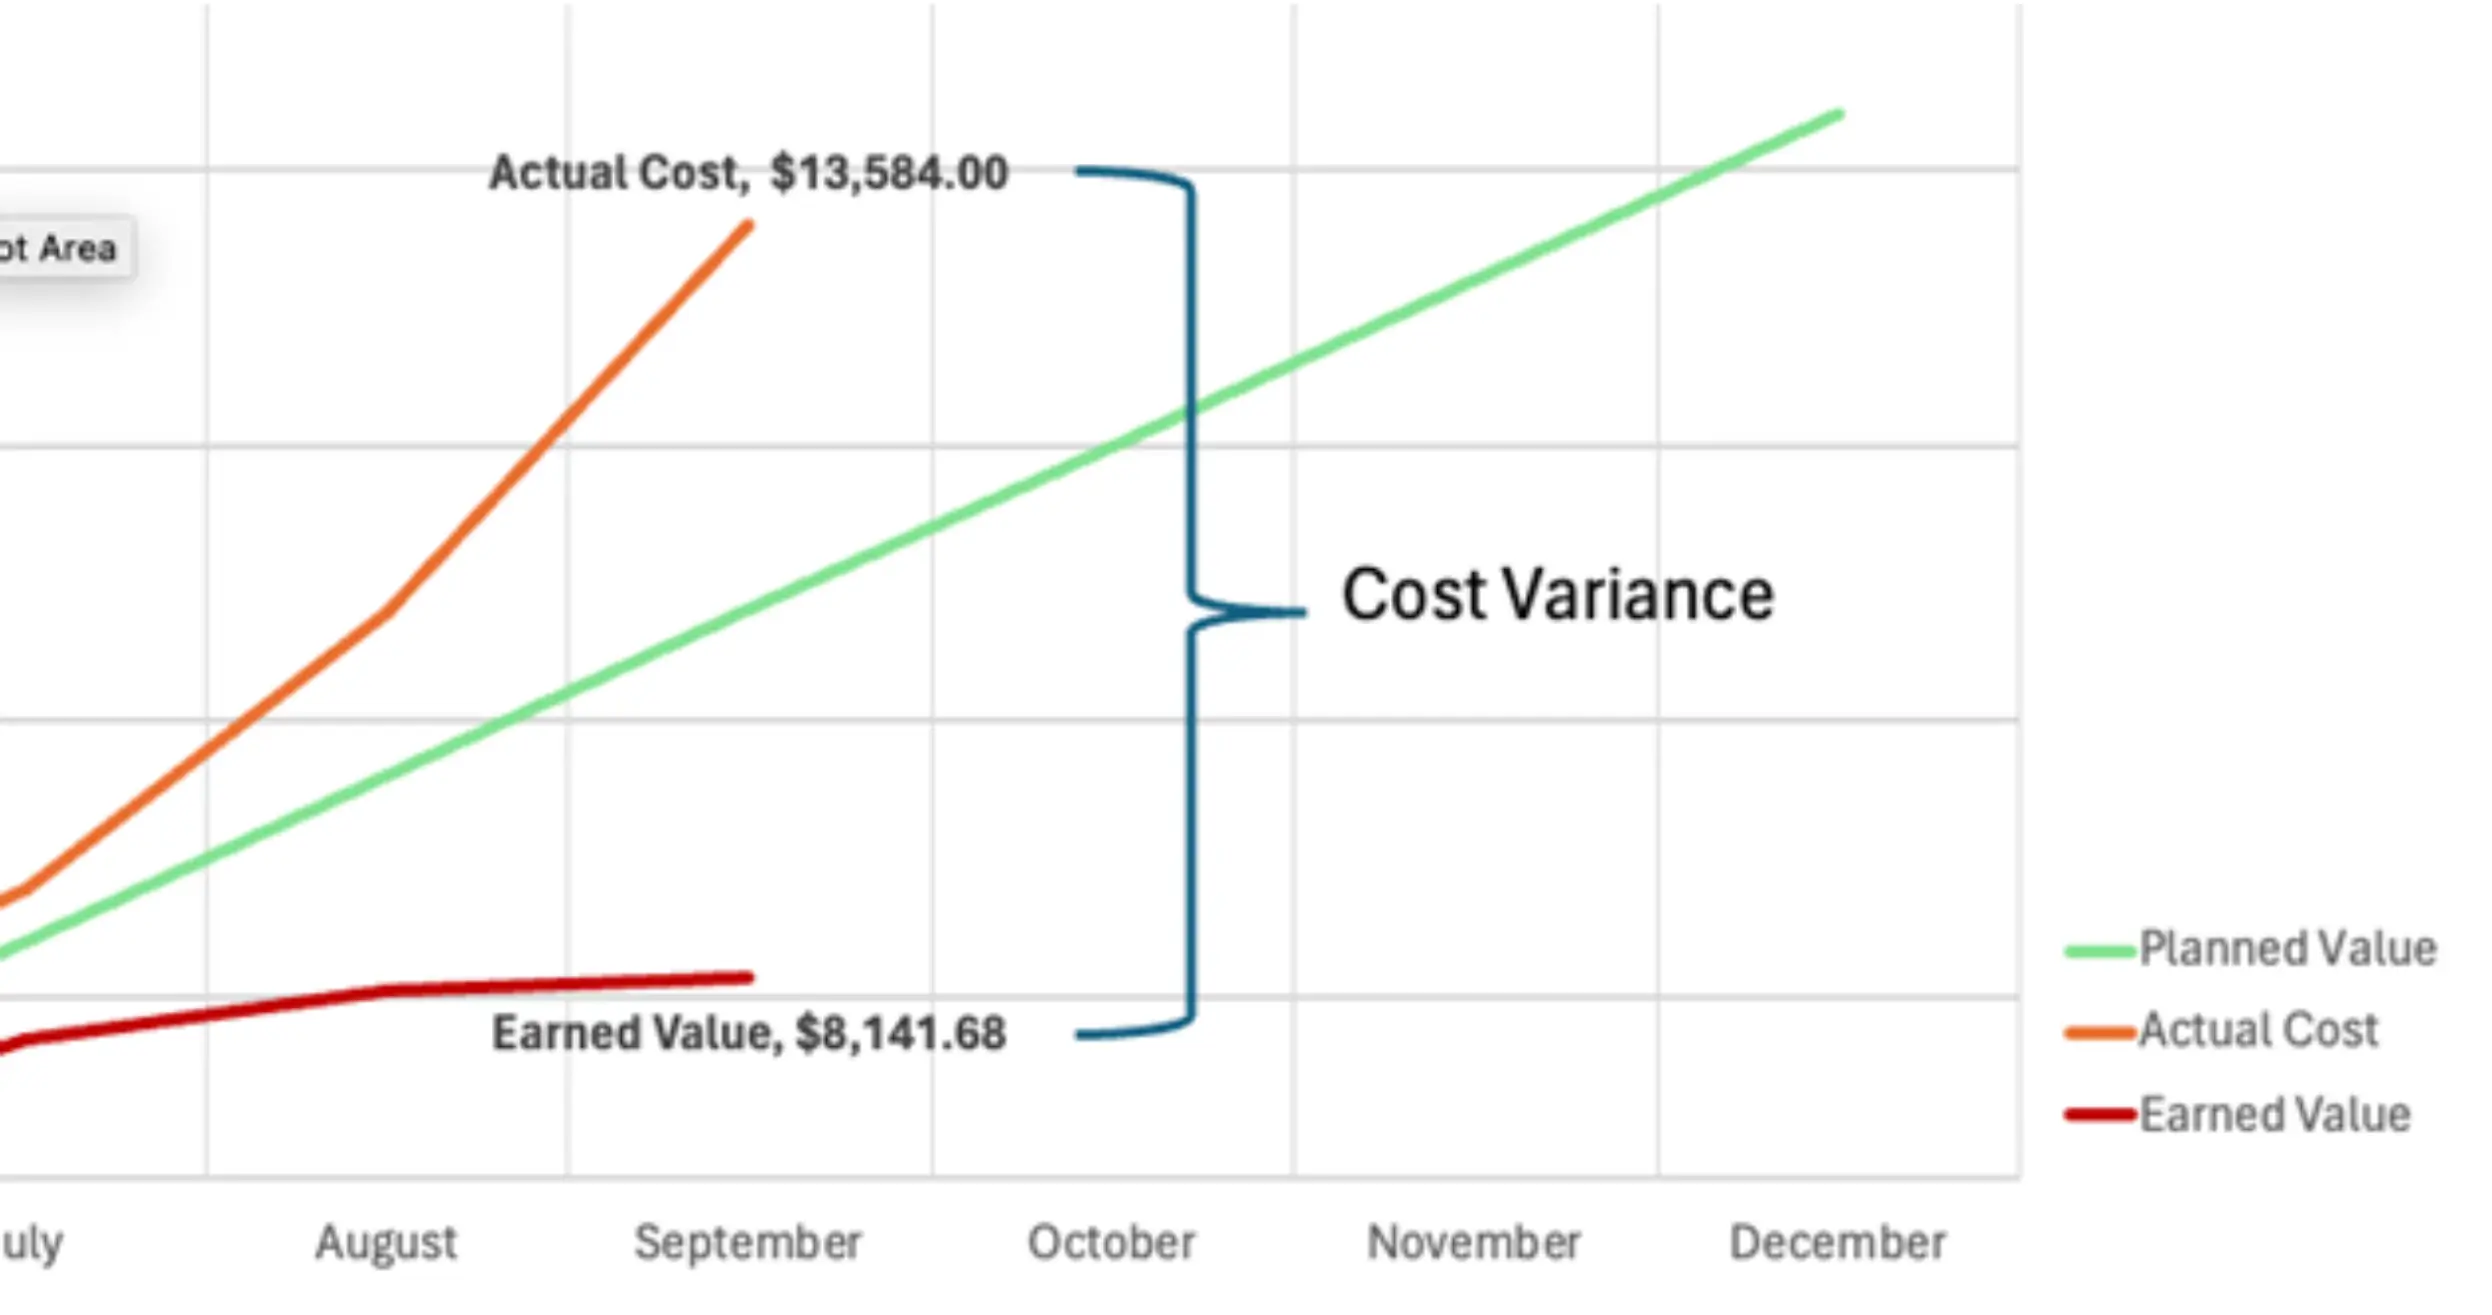
Zooming in you can see quite the negative trend from July onwards. You can also see the distance between Actual Cost and Earned Value. These numbers represent what has been spent (Actual Cost), and the return on the expenditure (Earned Value). As the Earned Value is less than the Planned Value the business is losing out.
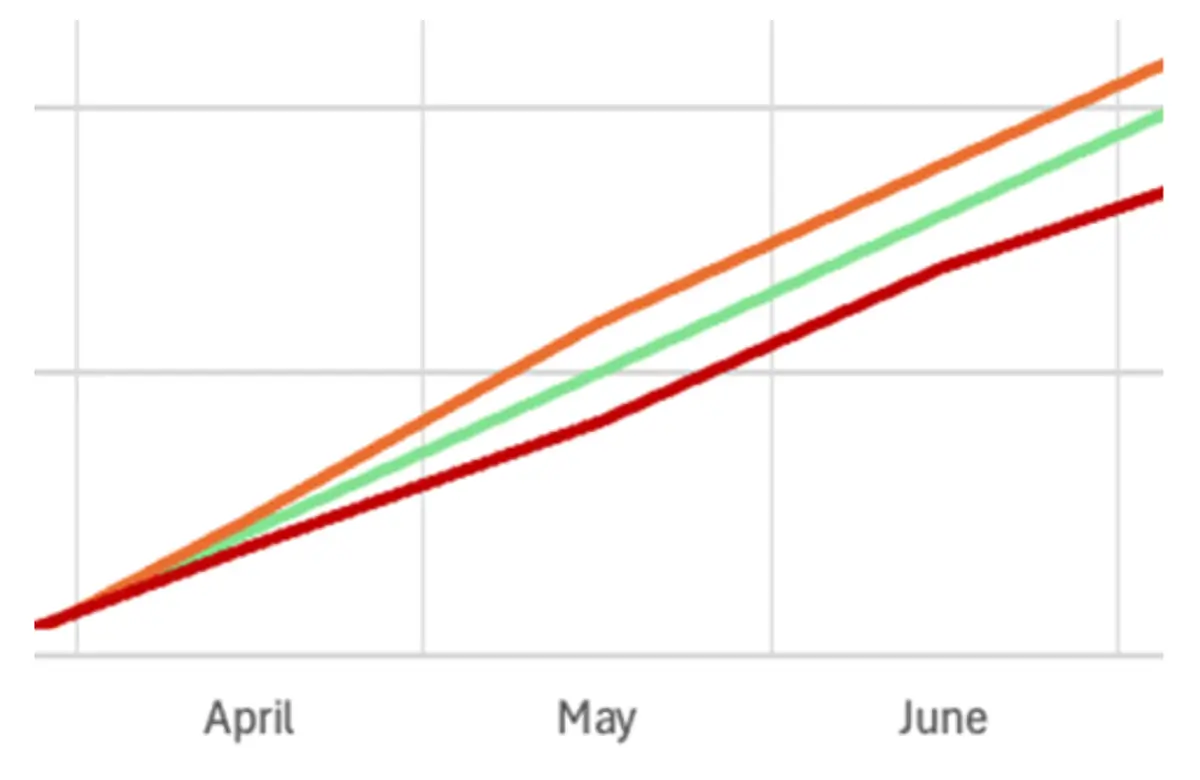
Looking back to the month of May we can see when the Earned Value started to drift south and produce a negative Cost Variance.
How to Implement Earned Value Management on a Dashboard
A great KPI to leverage on a dashboard that can be derived from Earned Value Management is the Cost Performance Indicator (CPI). By reviewing the CPI on a regular basis, you can quickly ascertain your current position. CPI is calculated by dividing the Earned Value by Actual Cost. A number greater than 1 represents a positive return, less than 1 represents loss.

Continuing with our return to sales near perfect seat sales in September CPI clearly shows a problem. CPI also shows the problem started in April or May.
| Month | Cost Performance Indicator |
| January | 1.0000 |
| February | 1.0882 |
| March | 1.0571 |
| April | 0.9590 |
| May | 0.8824 |
| June | 0.8960 |
| July | 0.8775 |
| August | 0.7469 |
| September | 0.5994 |
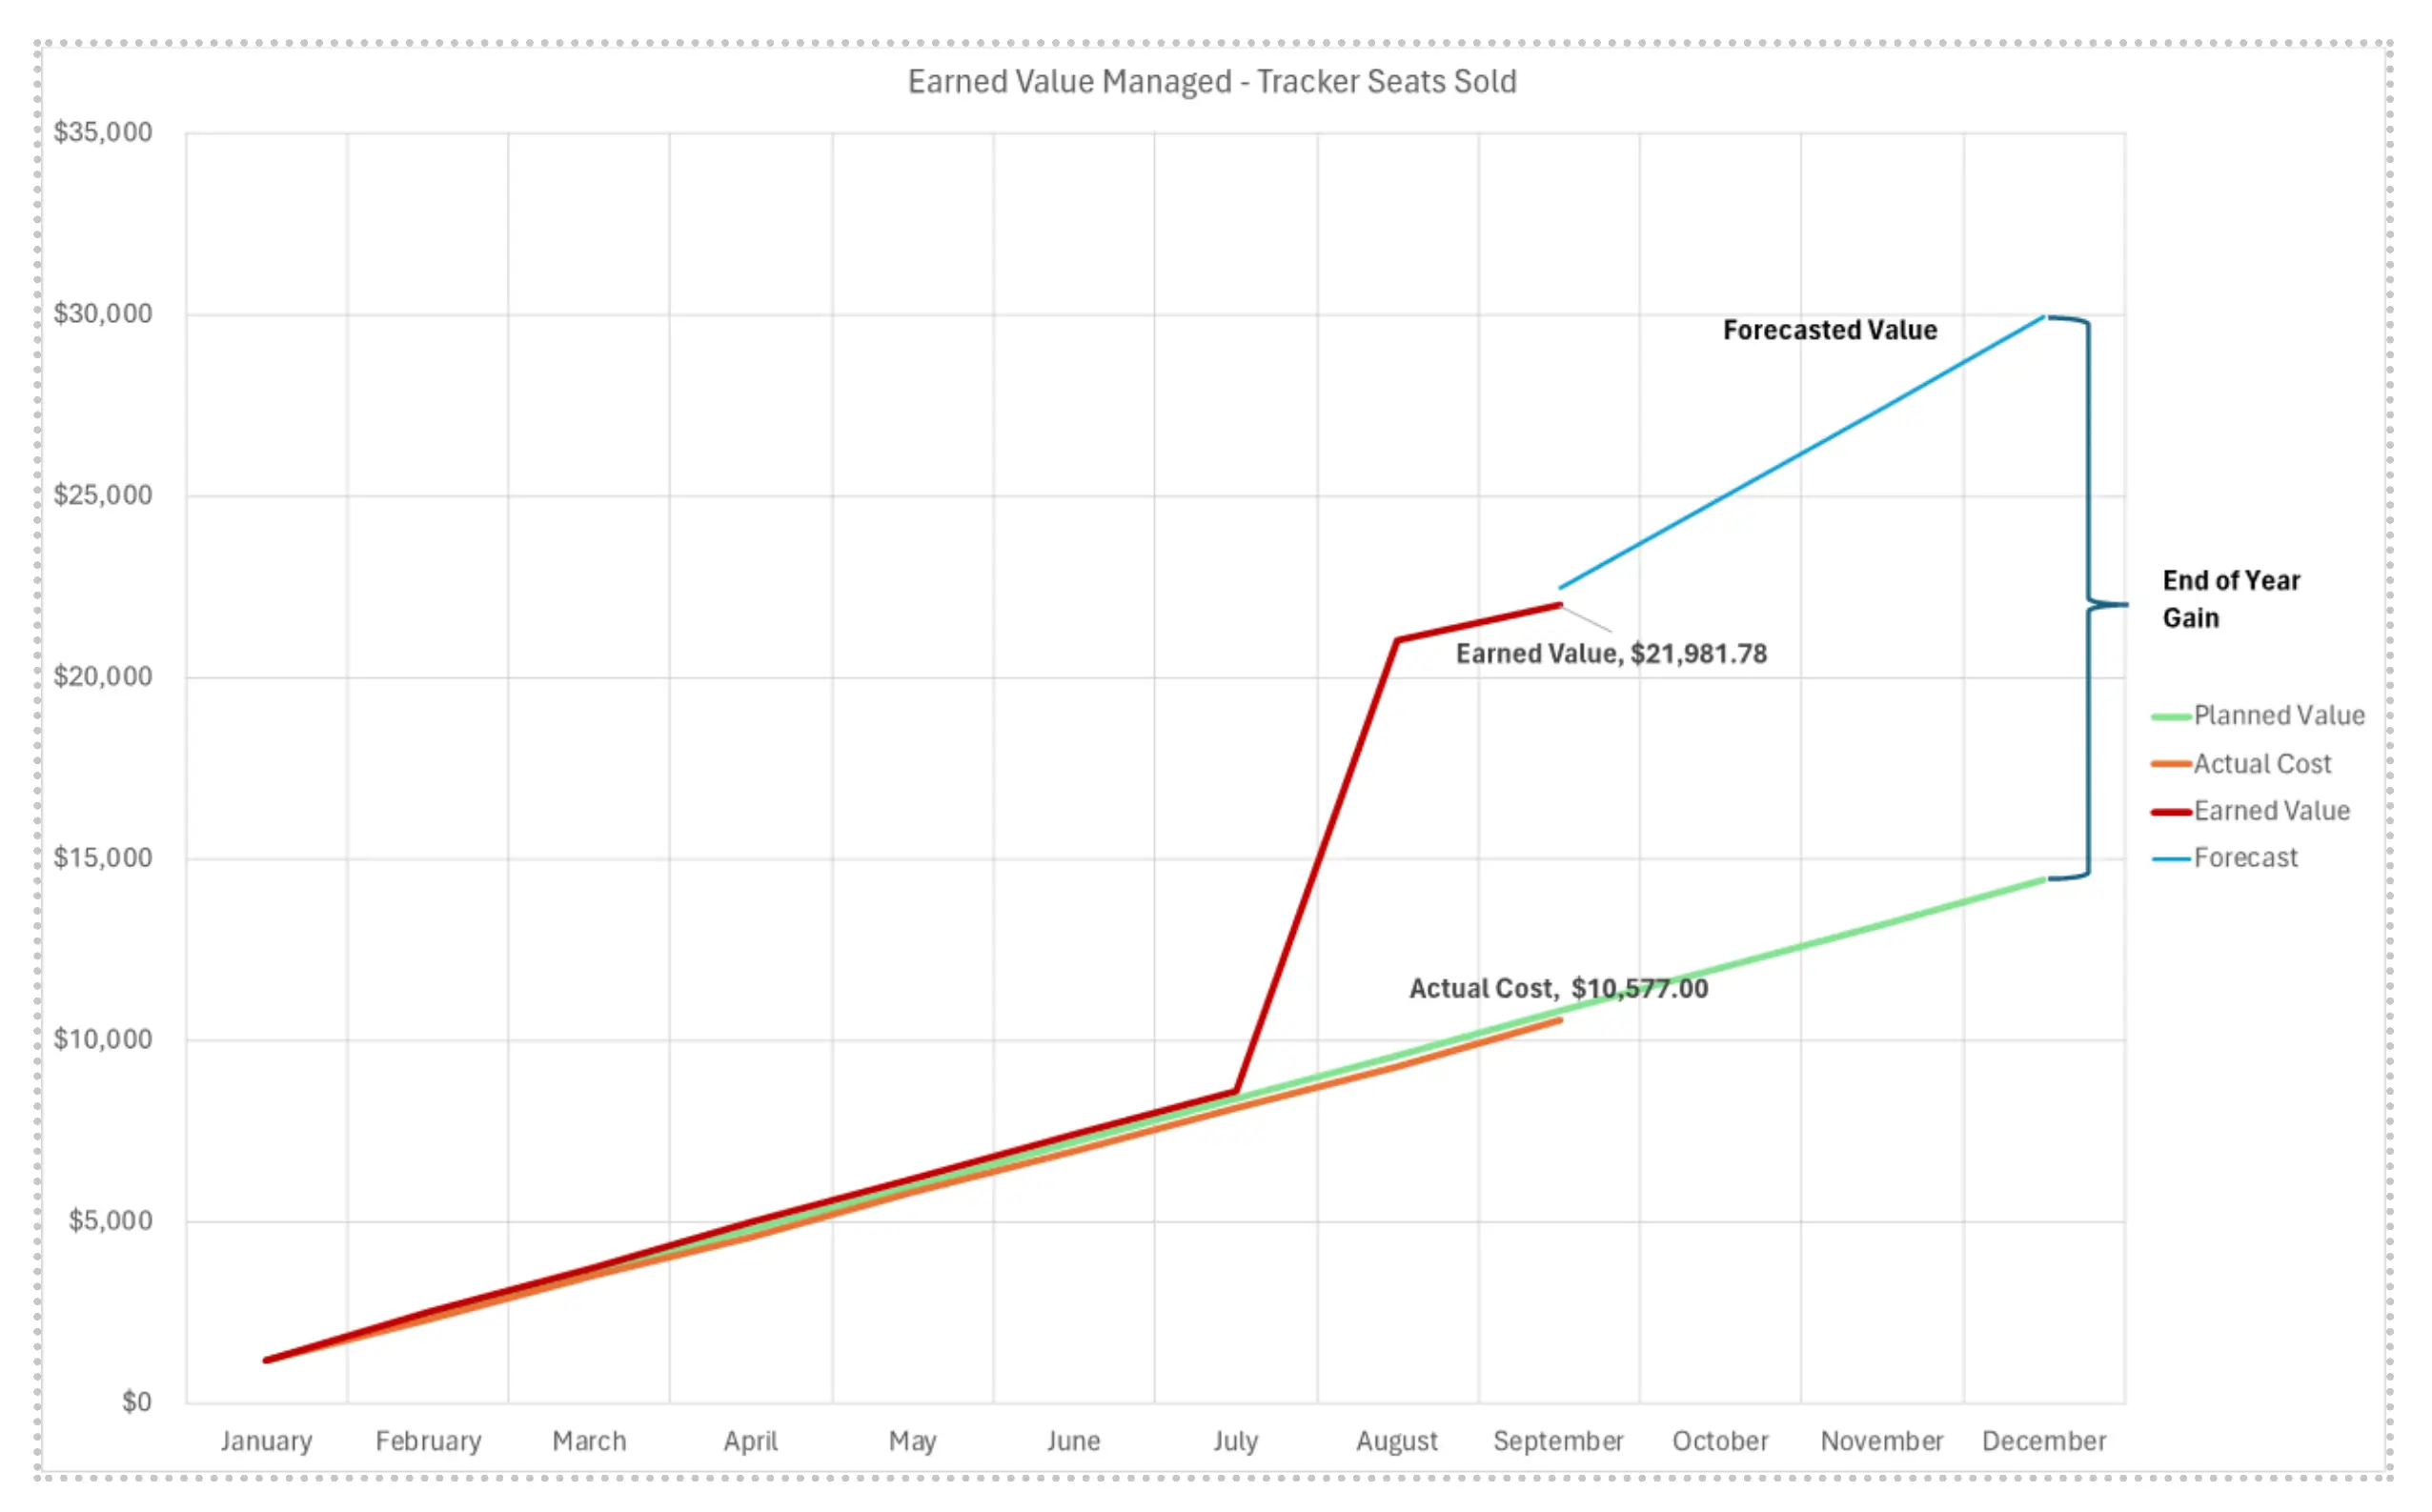
The last trick, that can also be applied to a dashboard, is a simple forecast (Forecast = Planned Value x CPI last ) that projects outcomes based on zero change. The chart below adds in the forecasted results if nothing was to change.
If the cause of the negative CPI is caught early, much can be changed. For example, the losses can be drastically reduced if ticket sales held the same, and the cause of the increase in cloud spend was fixed in June. The chart below shows this scenario.

Even better, if the fix is made and sales targets are achieved, the CPI turns positive.
What did AustPac Airlines Change?
Returning to my story about AustPac Airlines. Their change in their purchasing flow; adding a step whereby a user must enter their credit card and then “Apply” the credit card, may or may not be having unintended outcomes. However, if it is causing issues then pinpointing the cause will be incredibly difficult without the right tools for real user monitoring, conversion tracking and basket abandonment monitoring.
That said, with the right FinOps culture, engineering can help spur the investigation forward by bringing business value data to the table early and pushing for an in-depth investigation.
To prevent everyone rushing to AustPac Airlines’s website to view this checkout page I’ve included two screenshots. Yes, this was probably a BPKM, but never the less, it gave me a great story and a few minutes on hold.

A customer must click “Apply credit card” to be successful.

Conclusion
In conclusion, adopting Earned Value Management (EVM) within the FinOps framework is a game-changer for linking cloud spend to tangible business outcomes. This 40-year-old project management technique allows for a real-time view into budgeting, forecasting, and bench-marking, ensuring that every dollar spent on cloud services translates into business value.
By quantifying costs with Unit Economics and tracking metrics like cost per seat sold, companies can pinpoint inefficiencies and make informed decisions to optimize ROI. The AustPac Airlines case study illustrates how minor #UI changes can impact cloud costs significantly, highlighting the importance of continuous monitoring and analysis. Ultimately, EVM empowers teams to drive business value and improve financial performance in the cloud era.


