How to Proactively Monitor PLEG Health with Prometheus and Alertmanager Rules
Problem
The Pod Lifecycle Event Generator (PLEG) (introduced in Kubernetes 1.2) – a component which detects changes in container states locally – needs to remain in a "Healthy" state; it is imperative to proactively monitor vitals or metrics related to its health as it relates to the state of the node (which will transition into a "NotReady" state shall PLEG be deemed "Unhealthy" which will cease scheduling).
Environment
- Platform9 Managed Kubernetes – v5.4 and Higher
- Prometheus Monitoring
- Kubelet
Procedure
- If Prometheus Monitoring is not already enabled (it should be enabled by default, but, for older clusters this may not apply), follow the instructions in Enable In-Cluster Monitoring.
- Download Kubeconfig.
- Export Kubeconfig.
export KUBECONFIG=~/<cluster-name>.yaml- List the
PrometheusRulesin thepf9-monitoringnamespace.
$ kubectl -n pf9-monitoring get prometheusrules.monitoring.coreos.comNAME AGEsystem-prometheus-rules 22m- Edit the
system-prometheus-rulesobject and add the following rules.
$ kubectl edit -n pf9-monitoring prometheusrules.monitoring.coreos.com system-prometheus-rules spec: groups: - name: kube-events rules: - alert: KubeletPlegDurationHigh annotations: message: 'The Kubelet Pod Lifecycle Event Generator has a 99th percentile duration of {{ $value }} seconds on node {{ $labels.node }}.' expr: | node_quantile:kubelet_pleg_relist_duration_seconds:histogram_quantile{quantile="0.99"} >= 10 for: 5m labels: severity: warning [...] - name: kubelet.rules rules: - expr: | histogram_quantile(0.99, sum(rate(kubelet_pleg_relist_duration_seconds_bucket[5m])) by (cluster, instance, le) * on(cluster, instance) group_left(node) kubelet_node_name{job="kubelet", metrics_path="/metrics"}) labels: quantile: "0.99" record: node_quantile:kubelet_pleg_relist_duration_seconds:histogram_quantile- Access the Prometheus UI via Qbert API proxy (similar to Grafana) or via
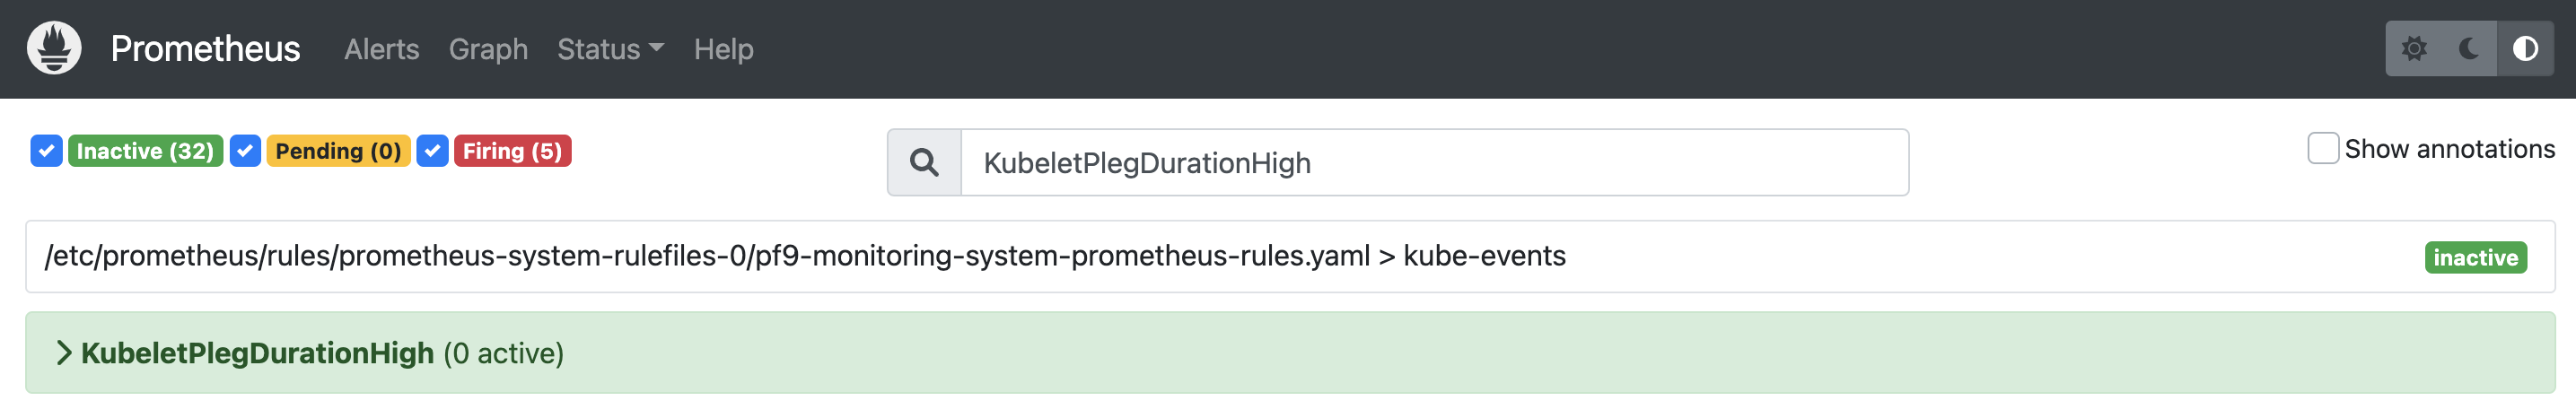
kubectl port-forwardassociated with theprometheus-operatedservice exposed on TCP/9090. - Navigate to the Alerts tab.
- Search for and/or verify from the list of alarms that the
KubeletPlegDurationHighalarm has been added and is showing green.
Was this page helpful?