Imported Clusters
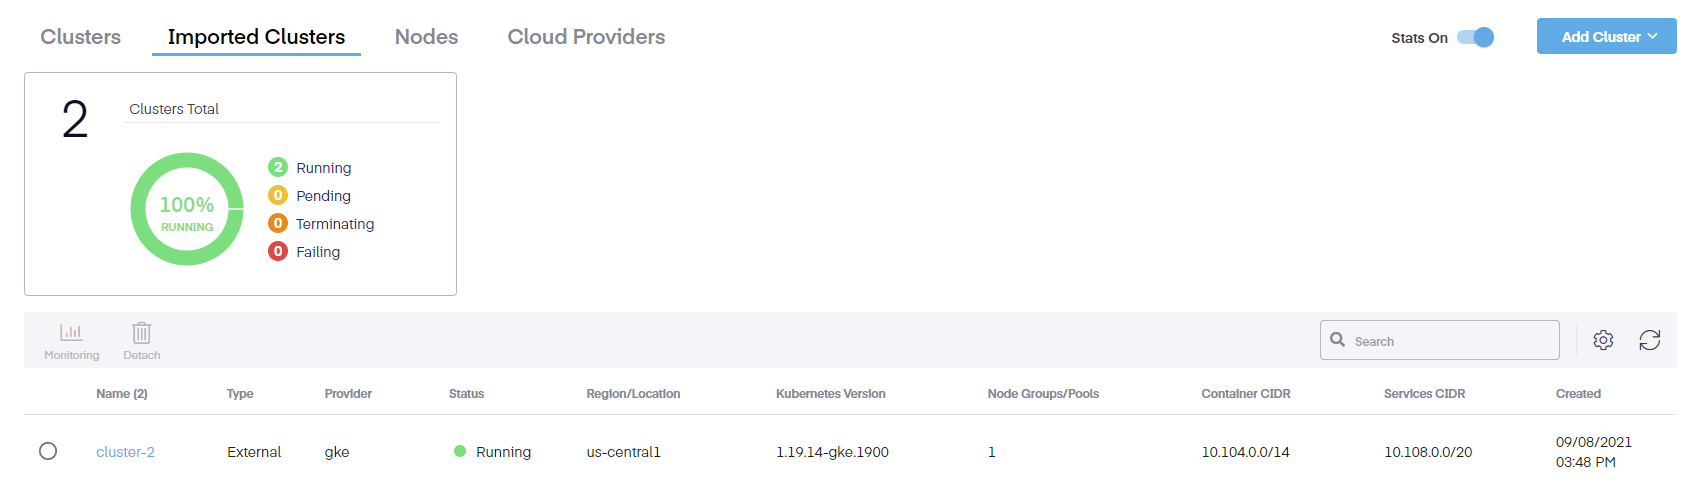
On the Infrastructure > Imported Clusters page, we see a graphical representation of the number of clusters that are either Running, Pending, Terminating, or Failing. Selecting the checkbox allows us to add monitoring or detach the cluster from the platform.
Detaching the cluster does not affect the remote cluster's functionality.
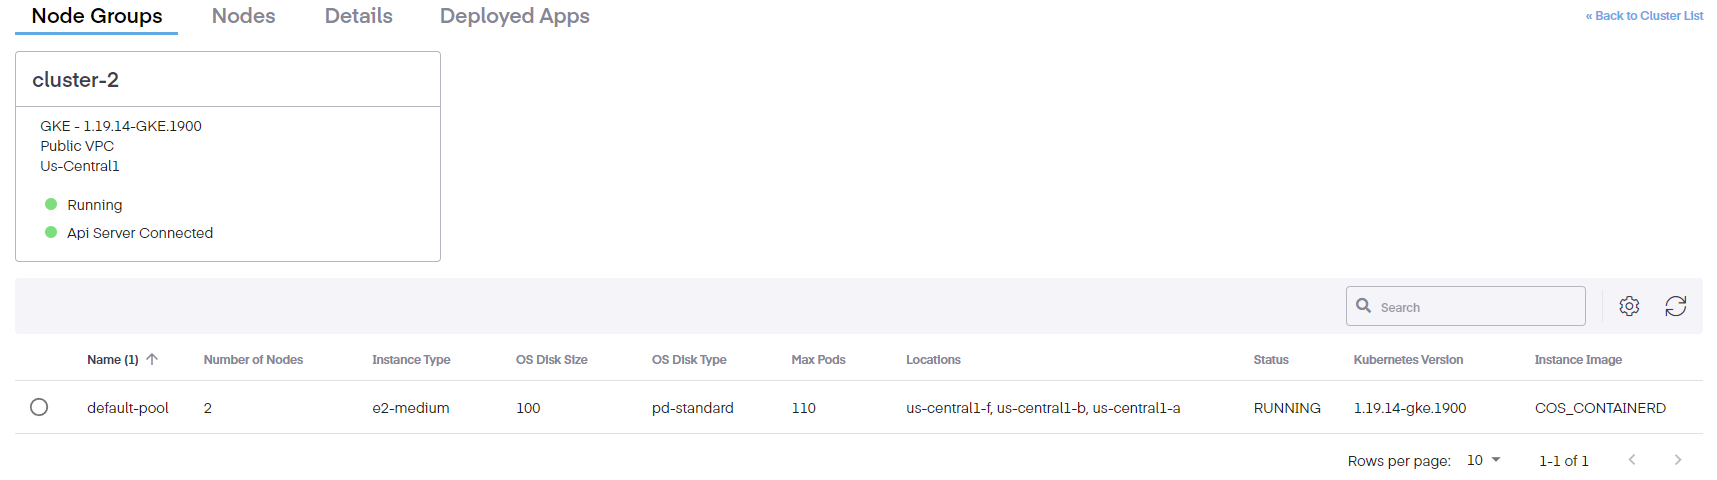
Clicking on the link associated with the cluster open a new page detailing more info regarding Node Groups, attached Nodes, other Specific Details, and any Deployed Apps.
Additionally, on the imported cluster page, we can add a cluster and modify the editable columns to observe specific cluster data.
- UUID – The unique identifier of the cluster
- Name – The name of the cluster
- Type – Displays the type of cluster being utilized
- Provider – If using a cloud provider like AWS or GKE, it is displayed here
- Status – Shows the current condition of the cluster
- Region/Location – Displays the region of the cluster if available
- Kubernetes Version – Defines the version of Kubernetes being used
- Node Groups/Pools
- Container CIDR – The assigned IP address range for the pods
- Services CIDR – The assigned IP address range for the services
- Created – Displays when the cluster was imported
Selecting a specific cluster, we can also detach it or enable the monitoring add-on. From here, users can access both the Prometheus and Grafana dashboards. Lastly, users will be able to spin up a Prometheus instances for monitoring applications.