Monitoring Rules
On the Monitoring > Rules page, we see a list of alerts that have been triggered and documented from a defined ruleset for a managed asset. It not only provides an overview, but also more in depth details. Options include selecting the name of the cluster, the severity level, and a search box to locate specific events or alerts.
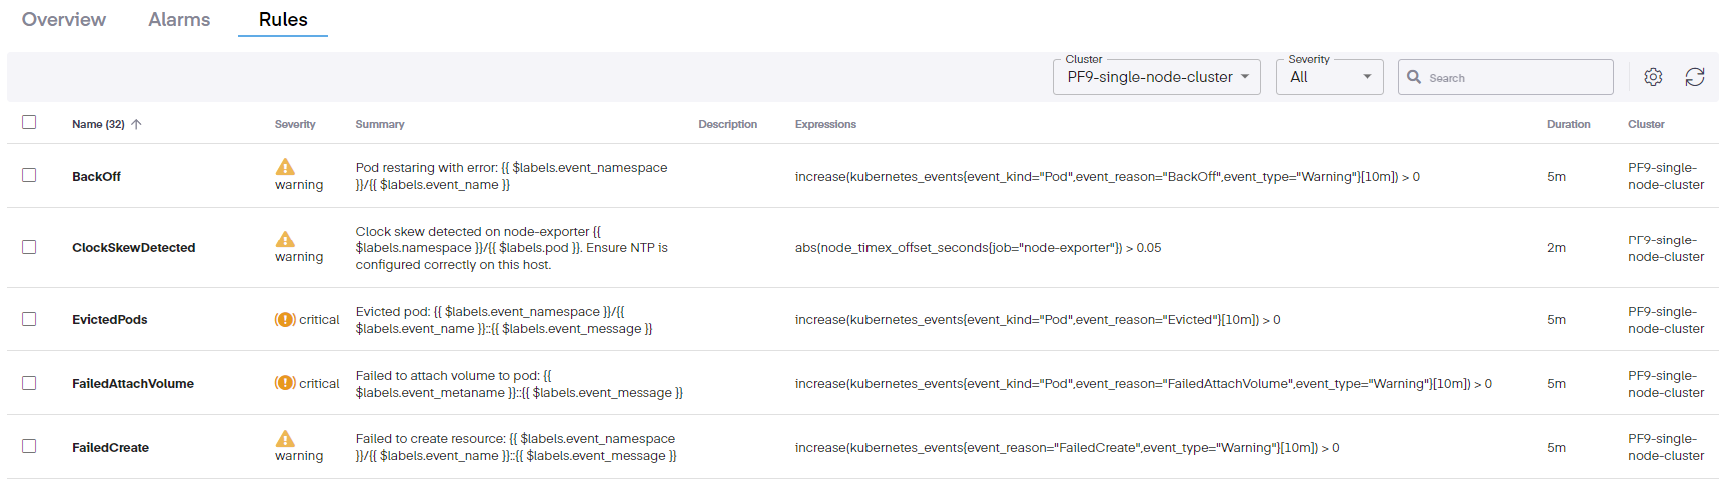
The columns provide the following details about the alert messages.
- Name – The name of the triggered rule
- Severity – The importance of the notification
- Summary – A short synopsis of the code and a description of when the rule activated, the alert message itself, and what occurred to cause the problem
- Description – A characterization or encapsulation of the event
- Expressions – the alert values that are reported for the event
- Duration – The duration denotes the period of time in which the event transpired
- Cluster – This field states the cluster where the alert occurred.
Clicking on the alert name bring up a small pop-up window with further details.
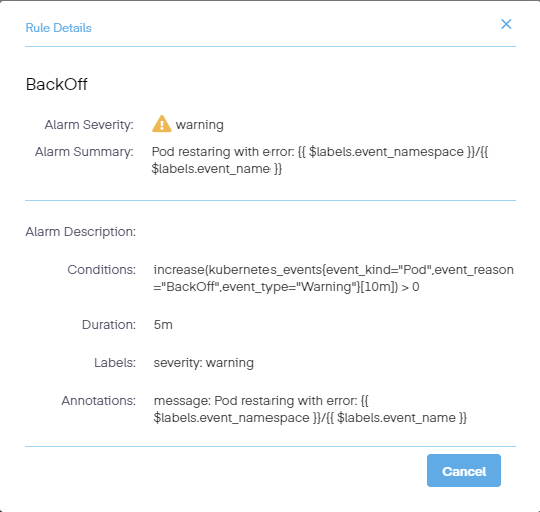
These details include the following information.
- The name of the rule
- Its severity
- A short summary of the issue
- A description, if one exists
- The conditions which caused the alert
- The duration of the event
- Any labels that are applied
- Annotations or comments about the event.
Was this page helpful?