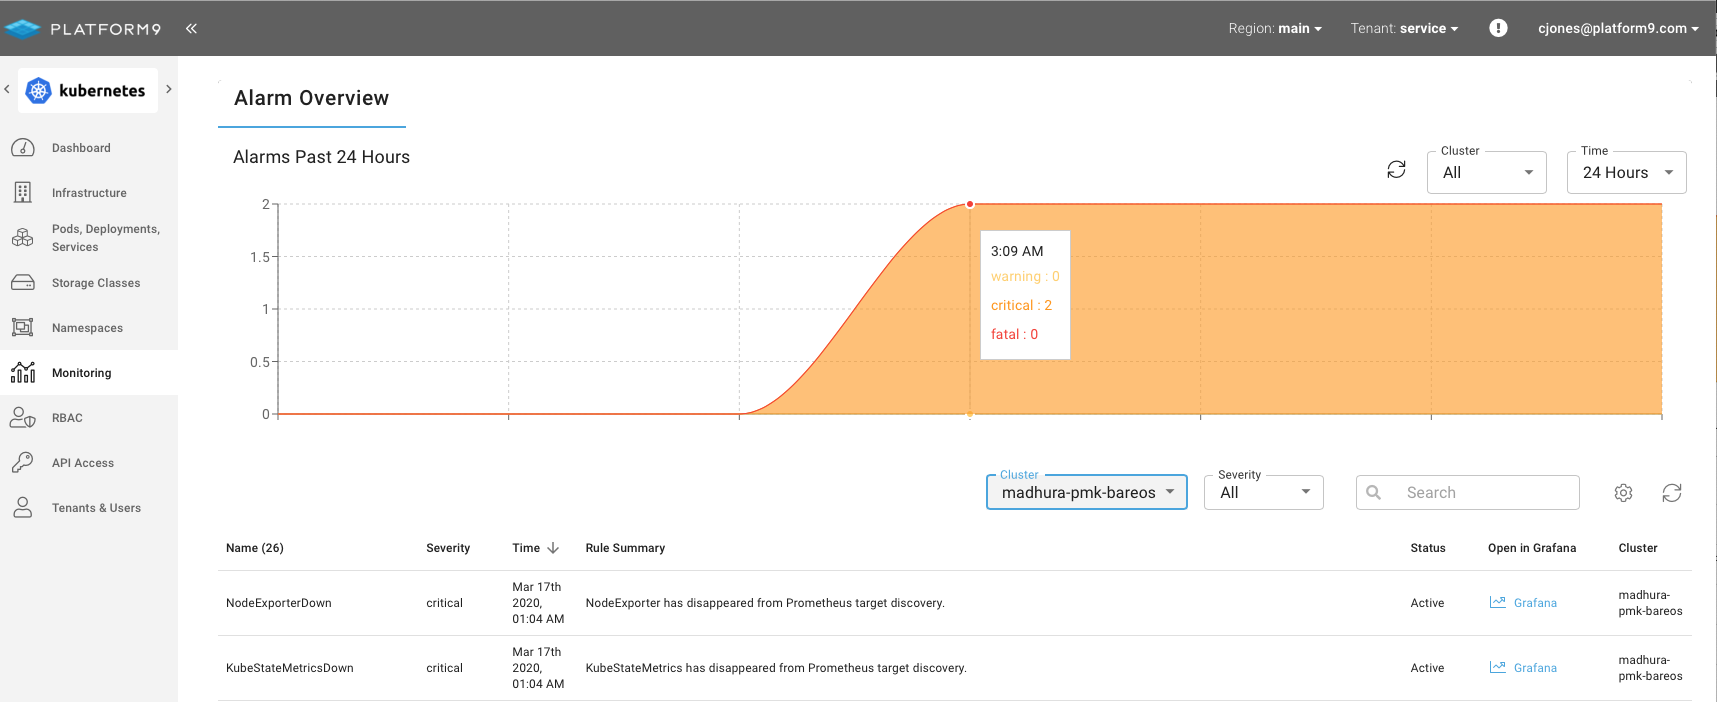
Monitoring Dashboard
The PMK Monitoring dashboard is a real-time multi cluster view into alarms for the last 24 hours. Using this dashboard you are able to filter alarms by severity, cluster and time. Each alarm contains a link to drill down to Grafana for further investigation.
My Monitoring Dashboard is Empty?
For the Monitoring Dashboard to populate at lease one cluster within your environment must have monitoring enabled.
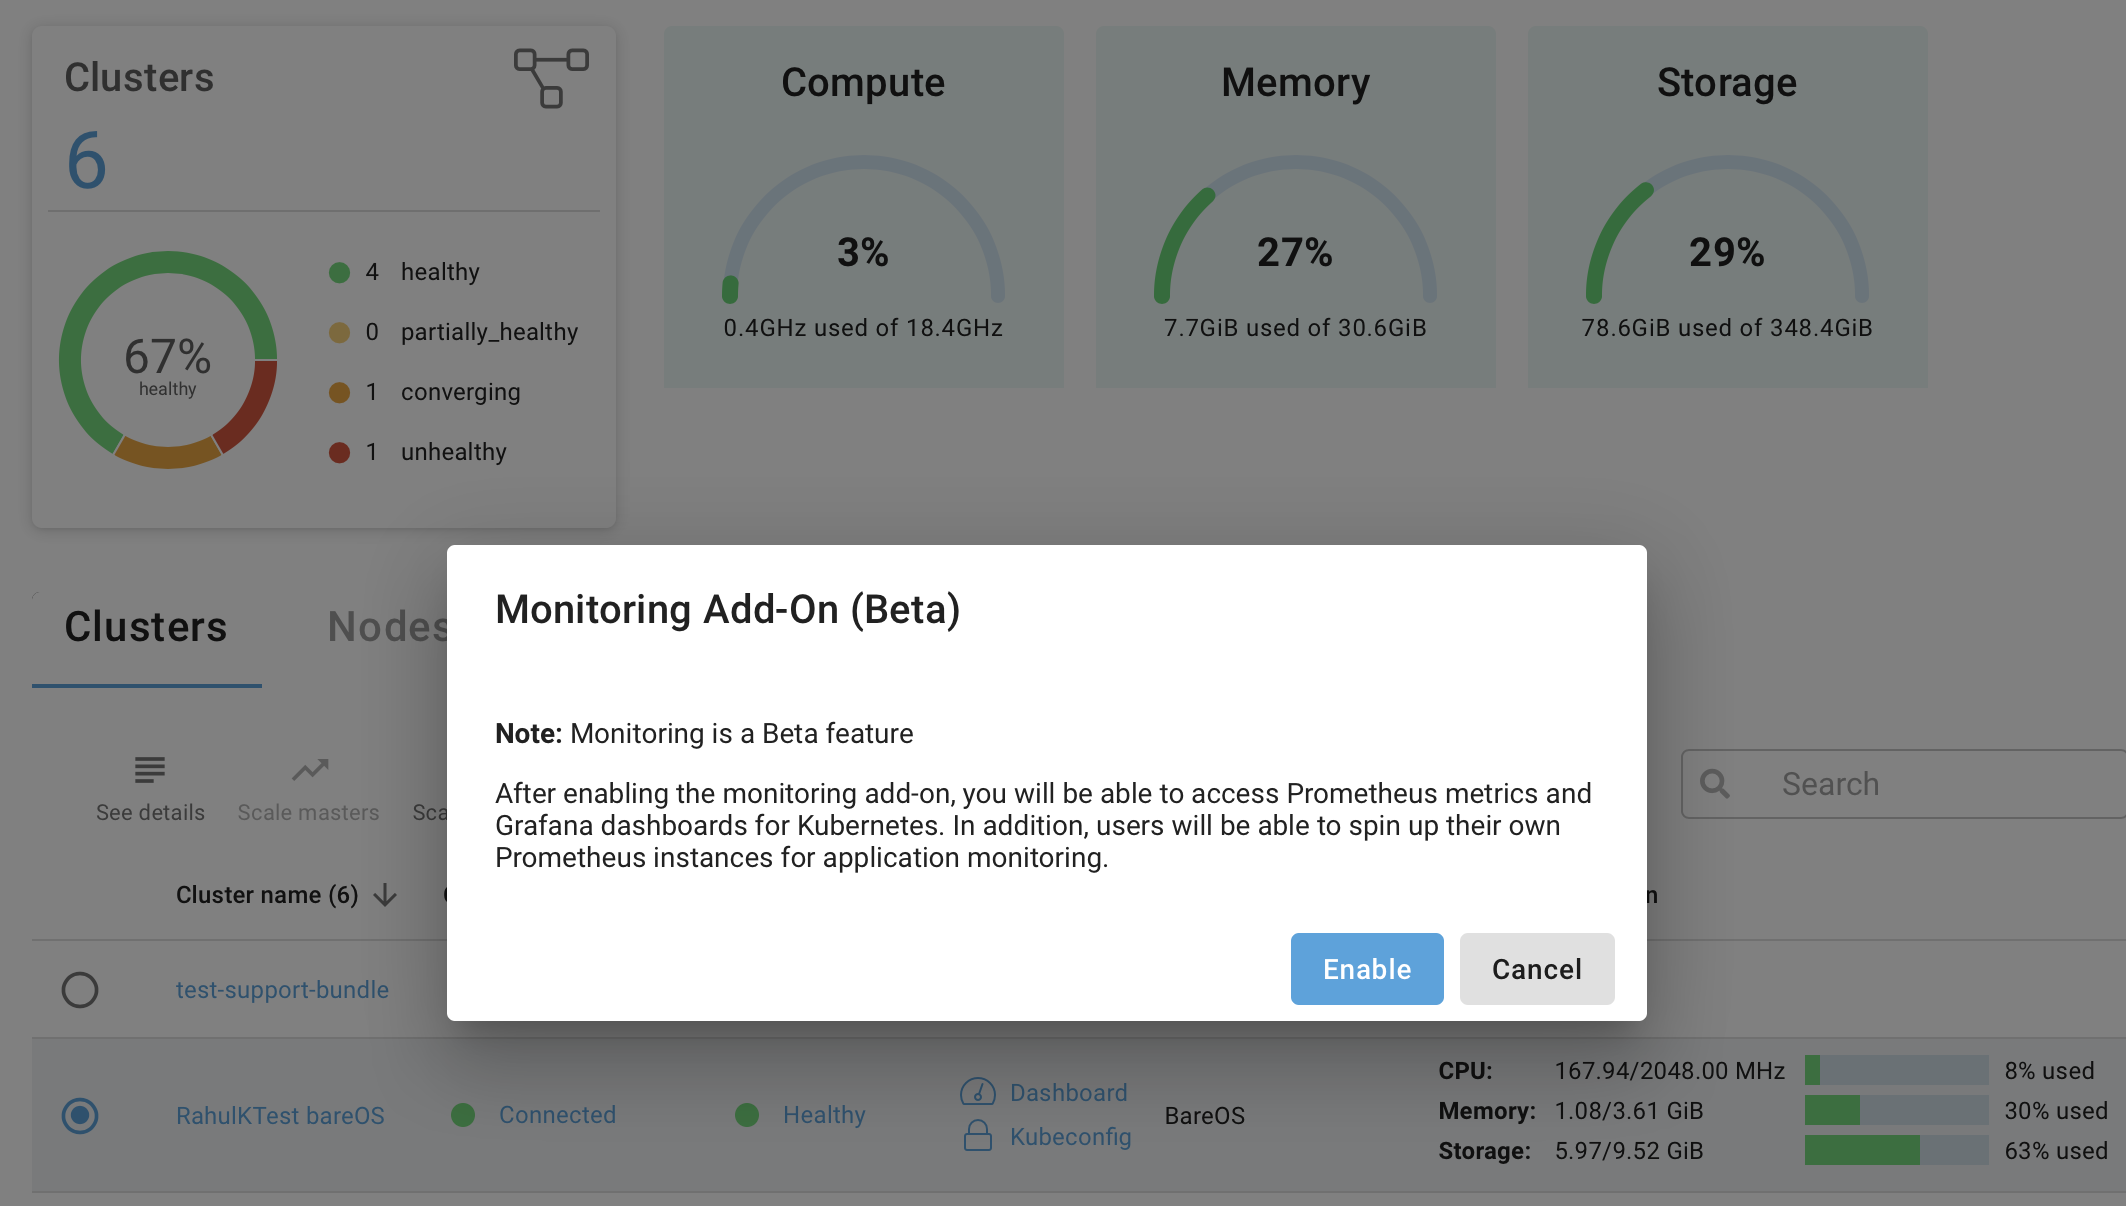
To ensure monitoring is enabled navigate to Infrastructure click the Clusters tab and then select a cluster, this will activate the table toolbar, then click the Monitoring button. In the popup click Enable.
Once enabled the Platform9 Management Plan will then deploy an Operator that runs Prometheus, Alertmanager and Grafana.
Depending on the clusters available resources the Operator may take up to 15 minutes to start all required Pods.
For the full guidance on enabling monitoring, refer to Enable In-Cluster Monitoring.