Monitoring Overview
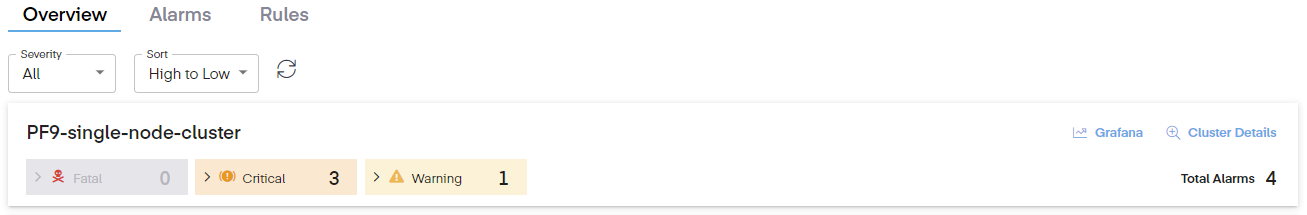
When the Monitoring tab is selected in the UI, the overview page is shown. It contains a dropdown menu for severity and priority. Also noted is a graphical overview showing the number of Fatal, Critical, and Warnings along with the total number of alarms. Clicking the circular icon refreshes the page. Above that are quick links to Grafana and the Infrastructure > Cluster (link) > Nodes page.
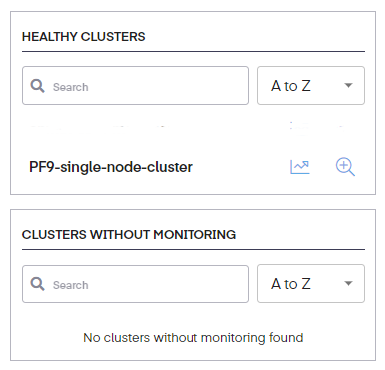
On the far-right side, we see and can easily sort Healthy Clusters and Clusters Without Monitoring. Under the Healthy Clusters are quick links to Grafana and the Infrastructure > Cluster (link) > Nodes page.
Was this page helpful?