Cluster Node Health
On the Infrastructure > Clusters > Node Health page, we can view the health of the node. It shows the name of the cluster, the type of cluster, connection status of the nodes in the cluster, whether the Platform9 components are healthy, and if the API server is responding for all nodes. Additionally, it provides links to Grafana, the kubernetes dashboard and the kubeconfig download config. A graphical overview of the attached nodes also shows the compute and memory resources available, along with the storage space available on all the nodes.
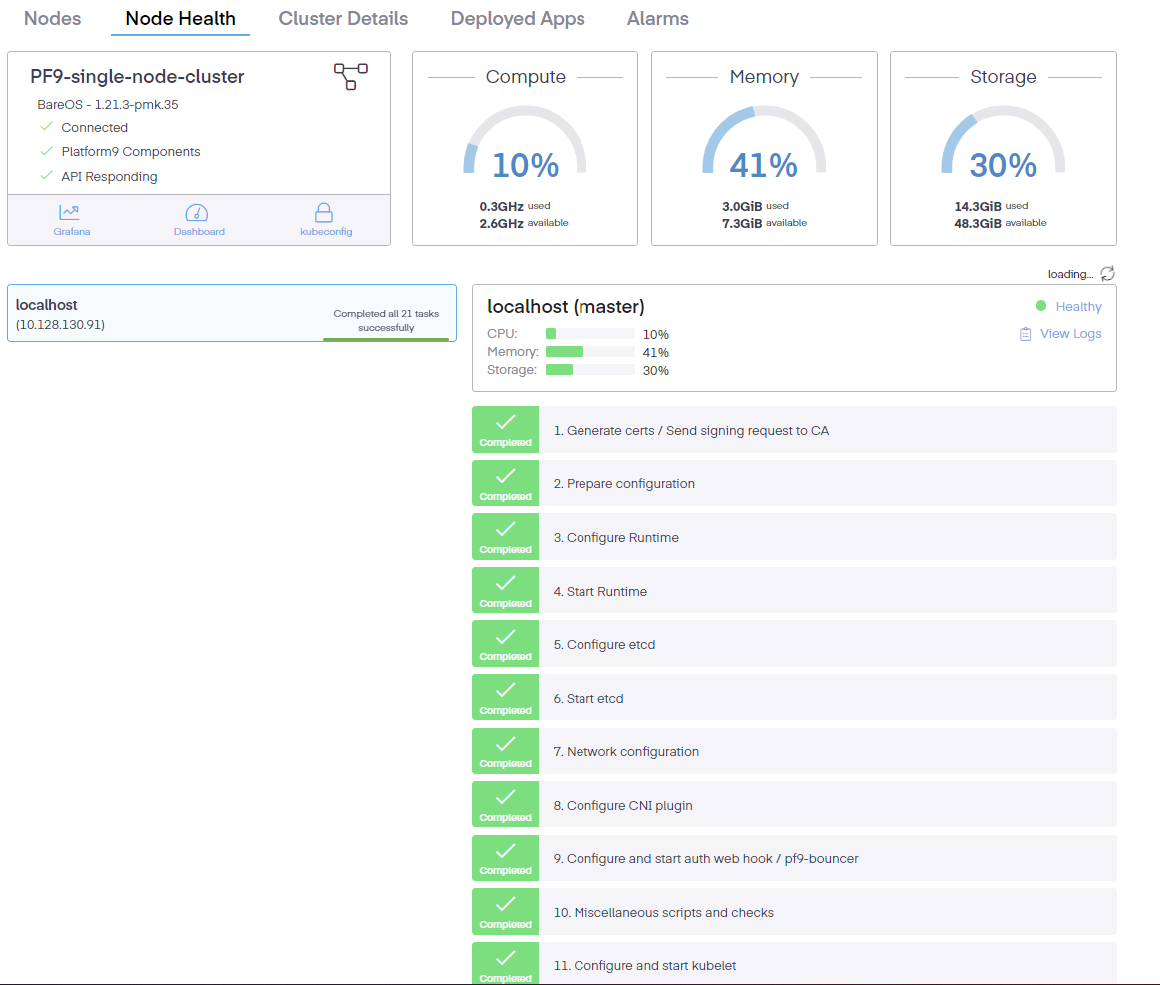
Furthermore, it displays the localhost address, the CPU, Memory, Storage and an available link to the most recent log entries. Finally, it provides a graphical illustration of the multiple completed tasks that verify its functionality.