Switching Dashboards
How to change between different dashboards in Grafana
Monitoring is preloaded with three sets of Kubernetes focused dashboards.
- Node
- Cluster
- Kubernetes
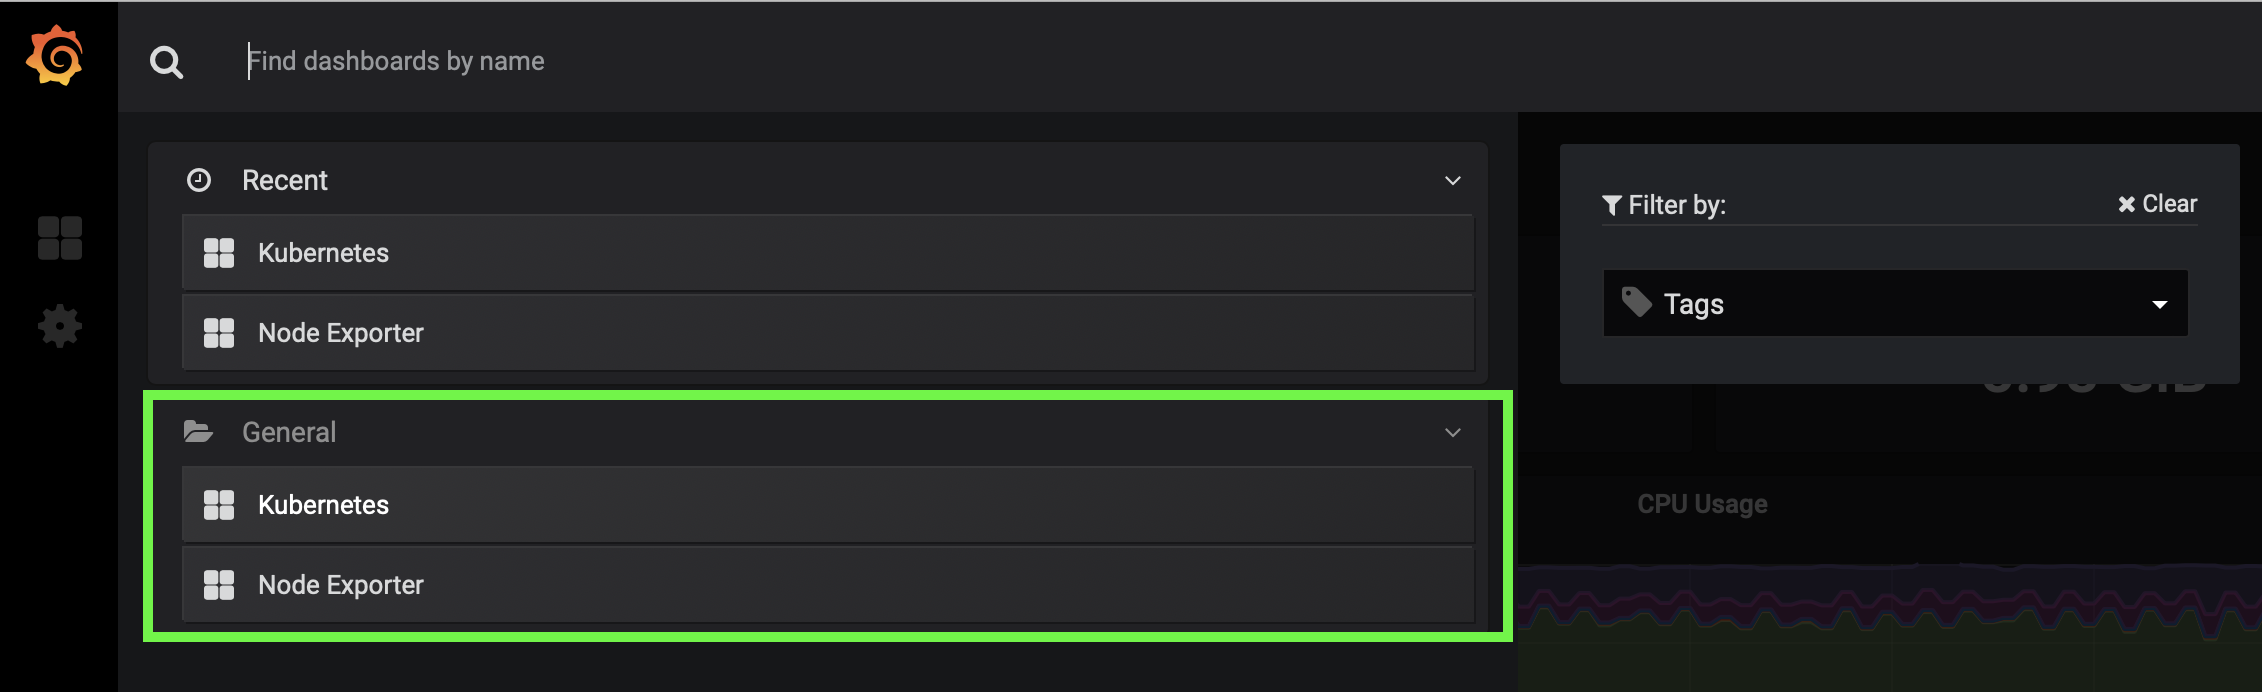
To change dashboards click the icon with four squares in the top right-hand corner of the dashboards.

Once expanded you are able to navigate to one of the alternative preloaded dashboards.
Was this page helpful?