In Cluster Monitoring
In-Cluster Monitoring Overview
The Platform9 current monitoring solution should now be defined as In Cluster Monitoring.
About Platform9 Monitoring
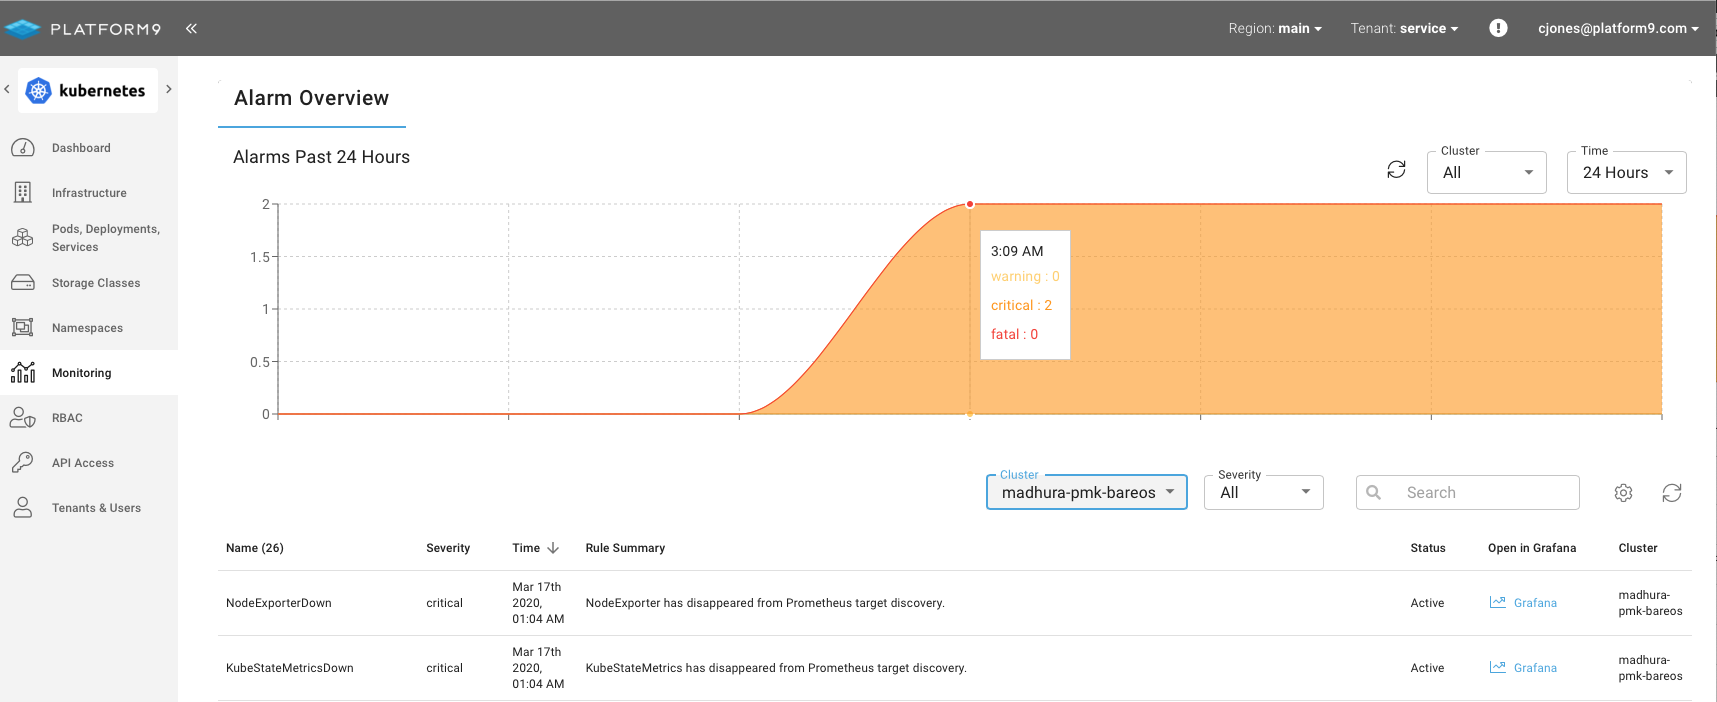
Platform9 deploys monitoring with every cluster to ensure that workloads run with a purpose-built metrics platform. This monitoring provides metrics across all nodes in a cluster as well as metrics from the Kubernetes cluster itself; covering pod metrics, cluster metrics, API Server metrics and OS level collections. Platform9 Monitoring consists of Kubernetes native open-source monitoring tools. When enabled, Monitoring deploys a pre-configured and integrated Prometheus, Alertmanager and Grafana that instantly provides insight into every aspect of the Kubernetes cluster, including a set of rules that fire alerts for the most critical of Kubernetes infrastructure.
Monitoring
The Kubernetes and the cloud native community have made monitoring a standard for operating infrastructure and containerized applications.
Why has monitoring become a required standard? Workloads running within Kubernetes are fundamentally different, not only has the infrastructure changed, so too has the application architecture. The result of this change is an environment that is significantly more complex than most virtualized workloads.
Historically, application teams and infrastructure teams tracked stateful workloads that persisted on a relatively stable hypervisor platforms that infrequently changed or were upgraded. Issues manifested in CPU contention, RAM over allocation and storage IOPS bottlenecks that with the simple tooling were easy to find and solve.
Advanced application issues required stepping into the application layer, complicating the monitoring and troubleshooting process with the requirement to understand trace level data, application heap usage, database performance and API response times. However, these workloads were fairly stable and static, in part dues to the complexity of monolithic application deployments. Containers and cloud native applications have transformed previously static and unchanging applications. Cloud native applications change faster, scaling up & down and leverage infrastructure that is also more dynamic and "needs" based. The simple application root cause analytics are no longer enough to provide the information needed.
As a provider and operator of Managed Virtualization & Kubernetes platforms, we face the challenges of dynamic environments every day.
Platform9 Monitoring is designed to help DevOps, SRE teams, ITOps and application managers quickly, easily and sustainably scale and operate multiple clusters across BareOS and Public Clouds. Providing certainty in deployments, observability of performance, notifications on availability and a mechanism to investigate root-cause that helps restore service faster.
Why is Monitoring Important
As Kubernetes workloads are transient and often stateless, investigating issues retroactively can be almost impossible. This results in prolonged customer-facing issues and costly investigations that impact release schedules and often result in complete outages. By having monitoring built-in by default, many issues are tracked, captured and persisted in a stateful platform that enables root-cause investigation in all environments; development, QA, Staging and Production. A repeatable and scalable monitoring platform ensures that issues are found, causes are identified and ultimately fixes are implemented and product quality improves.
About Prometheus
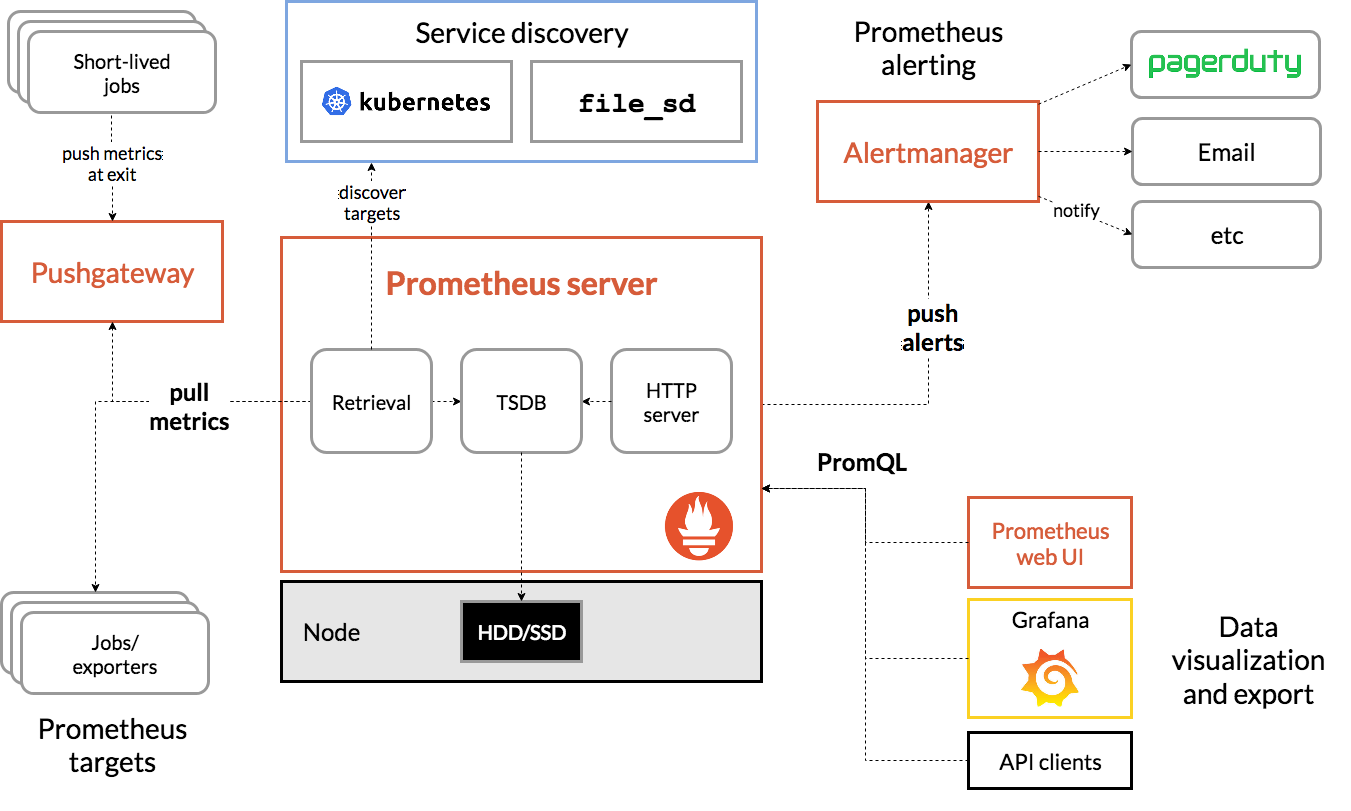
Prometheus has fast become the default open-source monitoring tool of choice for Kubernetes and many non cloud native environments. Able to run as a binary or container, Prometheus scrapes (remote collection) data from Exporters, stores the data in a time series database and integrates with Alert Manager for notifications and Grafana for dashboard visualization.
About AlertManager
Alertmanager operates by listing for alerts that are generated by rules that are periodically evaluating the metrics collected by Prometheus. Alertmanger can deduplicate, group and route alerts to downstream receivers. Alertmanger supports native integrations with email servers, PagerDuty, VictorOps, OpsGenie and any webhook-based interface. Alertmanager can also assist with the silencing and inhibition of alerts, which means that during change windows or prolonged outages, users can selectively pause notifications.
About Grafana
Grafana provides a simple and open source metric analytics & visualization tool. First released in 2014 Grafana is leveraged by thousands of users to visualize time series data from an extensive library of infrastructure and application platforms including Prometheus.

How to Enable Monitoring on a Kubernetes Cluster
Monitoring is enabled by default on all new Kubernetes clusters (you may opt out in the cluster creation wizard). If a cluster is already running, you can enable monitoring from the Infrastructure Clusters dashboard by selecting the desired cluster and clicking the Enable Monitoring button. Once enabled, Platform9 will create a dedicated Namespace within the cluster and utilize an Operator to set up and run Prometheus, Alertmanger and Grafana. After the deployment completes, a Grafana Dashboard link will be available on the Infrastructure Clusters view as well as the Cluster Details view.
For additional details, see Enable In-Cluster Monitoring.