PMK Navigation Overview
Dashboard Navigation
In the PMK dashboard, there are multiple tabs down the left-hand side that provide access to its multiple features and function. Below is a brief description of each tab and the information available within it.
- Dashboard – Details an overview of clusters, nodes, and cloud accounts. It also displays the region, tenant, notifications, user account, and admin settings.
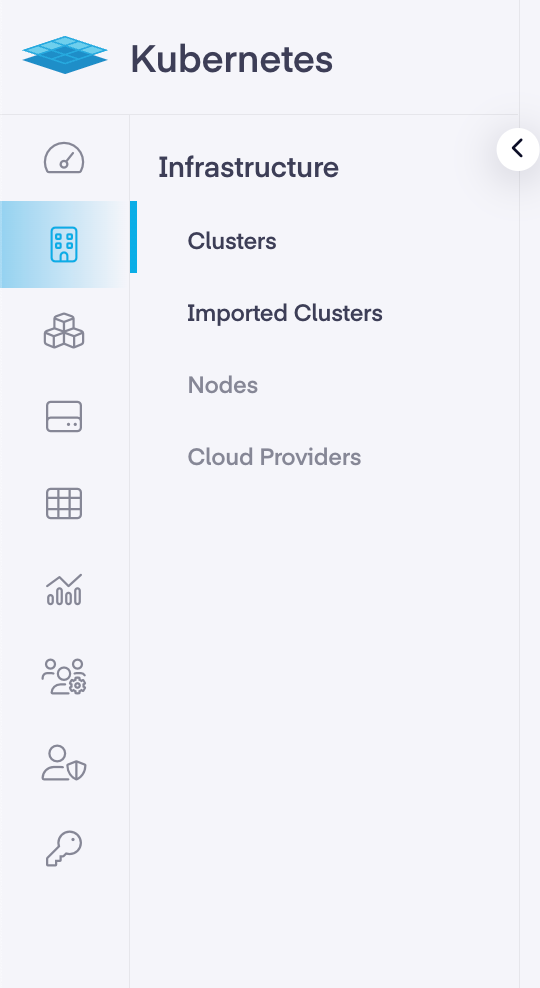
- Infrastructure – The infrastructure page provides the number of clusters, imported clusters, nodes, and cloud providers as well as a wealth of information on each.
- Workloads – This page displays pods, deployments, services, namespaces in addition to further specific insight about their capabilities.
- Storage – The storage page outlines the storage classes, persistent volumes, persistent volume claims, CSI drivers, storage providers and their associated details.
- Virtual Machines – This section details the KubeVirt components which make it possible for virtual machines to be managed by Kubernetes.
- Apps – This page show the app catalog, deployed apps, repositories, and the information related to them.
- Cluster Profiles – This page provides info on RBAC profiles, drift analytics, and the data associated with the current Roles, ClusterRoles, RoleBindings, and ClusterRoleBindings.
- Monitoring – The monitoring page shows an overview of the alarms, rules, and any notices available. It also provides links to Grafana and cluster details.
- RBAC – The RBAC page displays the current Roles, ClusterRoles, RoleBindings, and ClusterRoleBindings and their links components. It also allows for editing and deletions of those components, as well as the ability to add/remove verbs to a resource.
- API Access – The API access page features API services, kubeconfig, and terraform related access info needed to programmatically interact with PMK.
Was this page helpful?