Management Cluster Monitoring
This page covers the monitoring for the management cluster in SMCP.
Deploying monitoring stack
Monitoring components for the management cluster in SMCP are packaged as a Helm chart. This helm chart is bundled with with Airctl dependencies.
The helm chart is located at /opt/pf9/airctl/conf/helm_charts/ and can be found after the SMCP Installation.
The name of the chart follows the pattern kube-prometheus-stack-62.7.1-9.tgz.
helm install mgmt-monitoring -n pf9-monitoring /opt/pf9/airctl/conf/helm_charts/kube-prometheus-stack-62.7.1-9.tgz --create-namespaceAll monitoring pods status can be checked in pf9-monitoring namespace including Grafana, Alert-Manager, Prometheus etc.
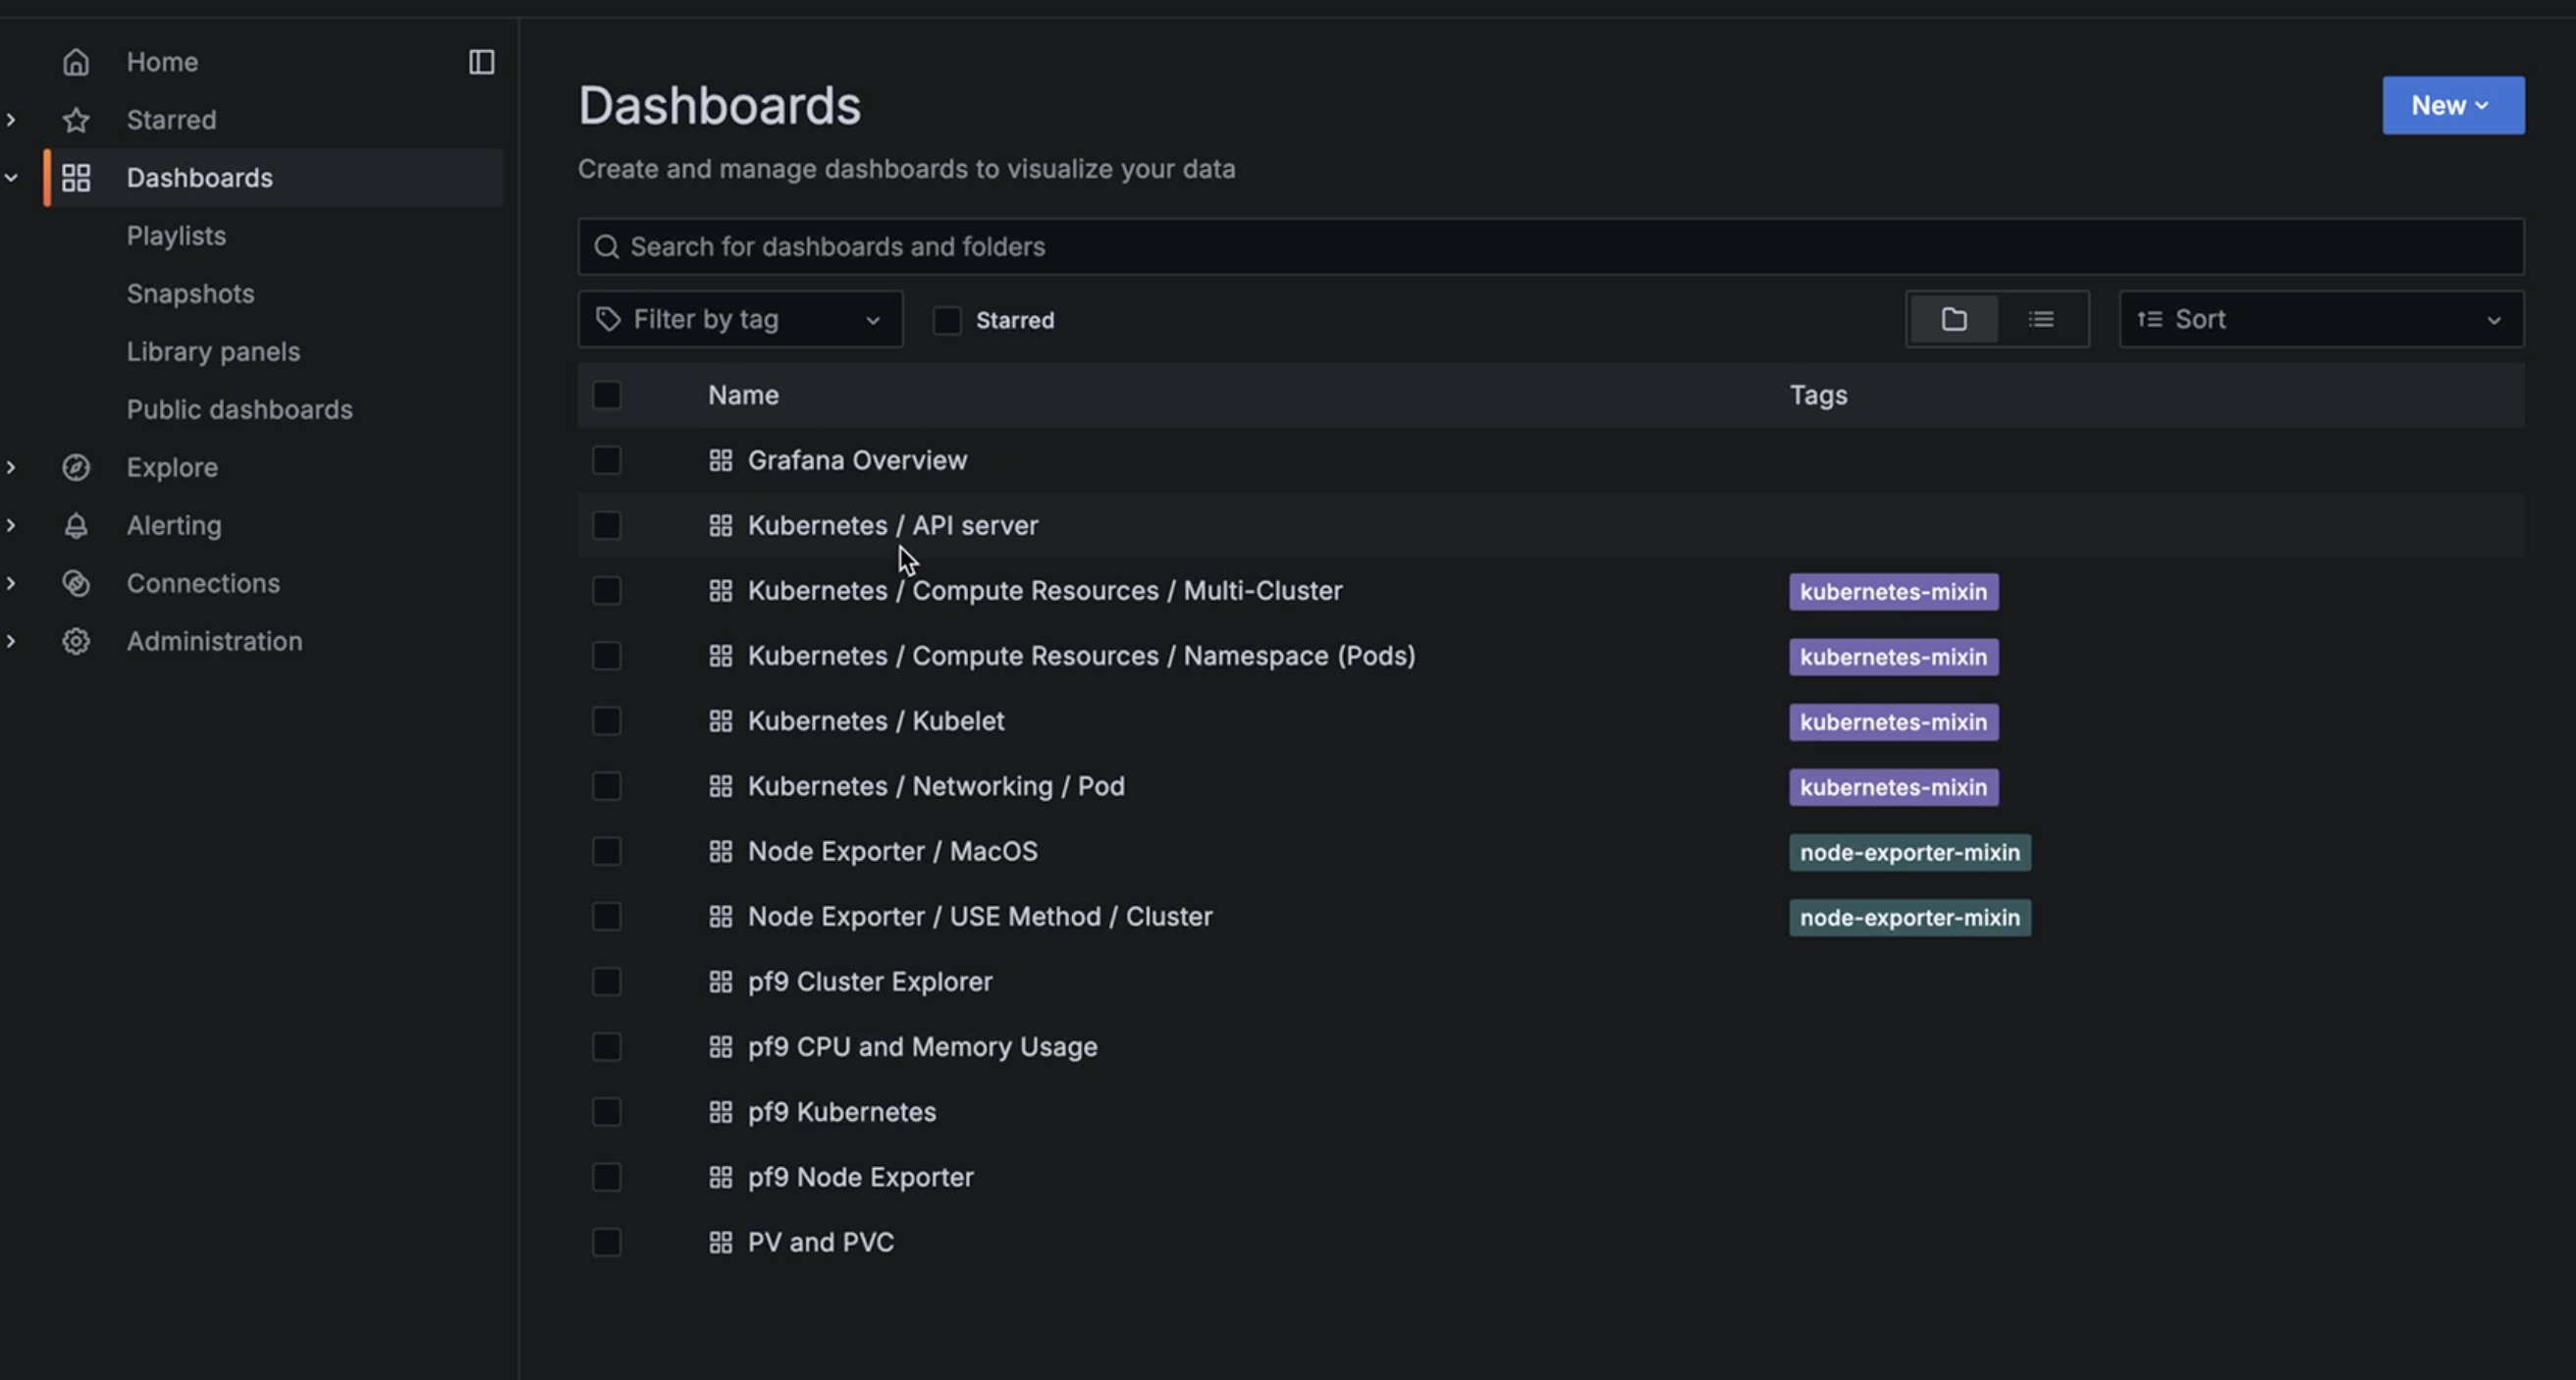
The deployed Grafana service already has dashboards pre-created for you to use. You can edit, add or remove by updating the helm chart.
Configuring monitoring stack
You can configure the monitoring stack deployment by updating the helm chart override.yaml to update the defaults configured in values.yaml.