EFK with Fluentd
Kubernetes is becoming a huge cornerstone of cloud software development. Kubernetes' deployments require many logs in many locations, and Site Reliability Engineers (SREs), DevOps and IT Ops teams are finding that more and more of their time is spent setting up logs, troubleshooting logging issues, or working with log data in different places. What can be done to solve this?
Fortunately, with advances in open-source tools and ready-made integrations from commercial providers, it’s now much simpler to set up and manage a logging solution. In this tutorial, we will use:
- Elasticsearch, a distributed, open-source search and analytics engine for all types of data
- Fluentd for log aggregation. Fluentd is an open-source data collector for building the unified logging layer
- Kibana, an open-source data visualization dashboard for Elasticsearch
- Kubernetes itself
Together, Elasticsearch, Fluentd, and Kibana are commonly referred to as the EFK stack.
We’ll be using solutions from Platform9 to rapidly implement a complete environment:
- Platform9’s Managed Kubernetes, which provides built-in Fluentd (early access)

Deploying Helm Charts
Helm charts are often created by organizations such as Jetstack, Bitnami, and Elastic – and are provided to the community to give them the ability to launch these organizations' software with a few command-line options. Helm charts also make it easy for developers to change the configuration options of applications. By editing the values.yaml file, an application can be set up in different ways – such as using a different database or using different configuration controls for production apps.
Here is a quick example on how you can work with Helm Charts
Go to artifacthub.io and search for the cert-manager chart. Find the official chart.
Select Install and you will see instructions on how to add the helm repository.
xxxxxxxxxx$ helm repo add cert-manager https://charts.jetstack.io$ helm repo updateNext, to install the chart, you can use:
xxxxxxxxxx$ helm install my-cert-manager cert-manager/cert-manager --version 1.4.0-alpha.0We cover installing cert-manager in more detail below.
For a production install, you’ll want to review the information on the Read Me file for each chart. A good example Read Me can be found here.
Platform9 deploys Prometheus and Grafana with every cluster, helping solve the monitoring piece, and we are actively developing a built-in Fluentd deployment that will help simplify log aggregation and monitoring.
Part 1: Deploying Kubernetes + Fluentd using Platform9
Platform9’s free managed Kubernetes service deploys, upgrades, scales, patches and manages your Kubernetes clusters. The first step to deploying a Kubernetes cluster with log monitoring is to sign-up for the freedom plan and then build a cluster.
Platform9 can run clusters in public clouds (AWS, Azure), private clouds, and edge locations with capabilities to manage from the bare metal up; a BareOS cluster. All clusters can be built using the Platform9 SaaS platform by connecting your public clouds or by onboarding physical or virtual servers.
The example below is using a four-node Kubernetes cluster running on Platform9 Managed OpenStack, but can be achieved using any virtual infrastructure, public cloud or physical servers. Once complete you will have Kubernetes cluster, managed by Platform9 with built-in monitoring, early access to our Fluentd capabilities connected to Elasticsearch and Kibana running on Rook CSI storage.
Here are the requirements:
Infrastructure:
Kubernetes Platform
- Single Node Control Plane (2 CPU 16 GB RAM, 1 NIC)
- Three Worker Nodes (4 CPU 16 GB RAM, 1 NIC)
- OS: Ubuntu 18.04
Rook Storage
- Three Volumes (1 per Worker node)
Software
- GitHub Installed and an Account
kubectl- Helm v3 Client
To install any charts and to manipulate the cluster ensure Helm 3 and KubeCtl are installed and that KubeConfig has been set up so that you can access the cluster. |
Visit here for help on Kube Config Files and visit here help on Helm
Sign up and Build a Cluster
This blog covers deploying a BareOS Cluster on a Virtual machine using Rook for persistent storage. Deploying onto Azure or AWS can be achieved by adding the native AWS or Azure Storage classes for the ELK data plane.
Head to www.platform9.com/signup and create a free account.
Once your account is active, create 4 virtual machines running either Ubuntu or CentOS in your platform of choice (Physical nodes can also be used), mount an empty unformatted volume to each VM (to support Rook) and then use the Platform9 CLI to connect each VM to the Platform9 SaaS Management Plane.
For this tutorial, I created a 4 node cluster with 1 master and 3 worker nodes.
Follow the article here to auto$, but note that all the parameters to be set as part of the wizard below, to properly configure and enable fluentd as part of cluster creation.
Master node setup: Single master node with Privileged Containers Enabled
- Select the node that will run as Kubernetes master. This node will run the Kubernetes Control Plane.
- Ensure the Privileged Containers option is enabled.
Workers Setup: Three Worker Nodes
- Select the three nodes you are using in this cluster.
Network Setup:
- Cluster Virtual IP: Leave All fields empty, as we are creating a single master cluster.
- Cluster Networking Range & HTTP Proxy: Leave with Defaults
- CNI: Select Calico and use the default configuration
- MetalLB: Disabled
If we want to deploy MetalB, ensure the IP Range for it is reserved within our environment and that port security will not block traffic at the Virtual Machine level. |
Set Required Tags To Enable Fluentd During Cluster Creation
NOTE - Enabling Platform9 Fluentd is an Early Access Feature only right now.
Platform9 has a built-in Fluentd operator that will be used to forward logs to Elasticsearch. To enable the Fluentd operator, add the following tags to the cluster's configuration as part of the cluster creation wizard:
- Ensure monitoring is enabled.
- Use the following tags in the cluster tags field to enable Fluentd.
- key:
pf9-system:logging - value:
true
Now, review the cluster creation request and hit complete.
Your cluster will now be built, and you will be redirected to the Cluster Details page, where you can review the status of the cluster deployment on the Node Health Page.
Once the cluster has finished being built, you can confirm Fluentd has been enabled in two places.
- Select the cluster and choose Edit on the Infrastructure dashboard. On the Edit screen, you should see the tag for logging added.
- Navigate to the Pods, Deployments and Services dashboard, and filter the Pods table to display the Logging Namespace. You should see Fluentd pods running.
Part 2: KubeConfig and CertManager
KubeConfig is critical for connecting and managing Kubernetes clusters. In addition, CertManager is a great application to have installed in all clusters, as it can greatly simplify the management of certificates. As a way to validate your cluster and ensure you can connect to it, we will download KubeConfig and install CertManager using Helm 3.
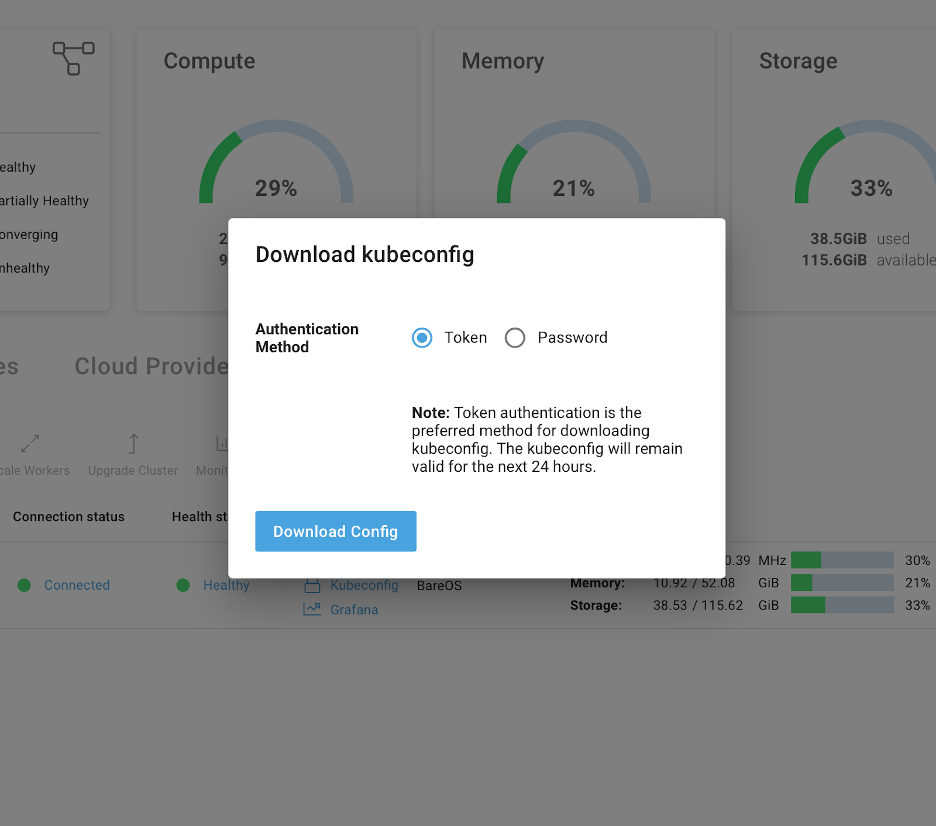
Step 1: Obtain KubeConfig
Once the cluster has been built you can download a KubeConfig file directly from Platform9, choose either token or username and password and place the file in your .kube directory and name the file config. Visit here for help on Kube Config Files.
Step 2: Create a namespace
For this example, I’m using a namespace called monitoring-demo, go ahead and create that in your cluster:
xxxxxxxxxx$ kubectl create namespace monitoring-demoStep 3: Add Cert Manager
We can use artifacthub.io to search for the Jetstack Cert-Manager chart location. After finding the official chart, we can install the chart repository and then the chart itself.
Chart Location: https://artifacthub.io/packages/helm/cert-manager/cert-manager
Install Cert-Manager:
To ensure Cert-Manager installs and operates correctly you need to first create a namespace for cert-manager and add their CRDs, that’s Custom Resource Definitions.
- Create the
cert-managementnamespace:
xxxxxxxxxx$ kubectl create namespace cert-management- Install the CRDs:
xxxxxxxxxx$ kubectl apply --validate=false -f \ https://github.com/jetstack/cert-manager/releases/download/v0.16.1/cert-manager.crds.yaml- Install the helm chart for cert-manager:
xxxxxxxxxx$ helm install my-cert-manager cert-manager/cert-manager \ --namespace cert-management \ --version 0.15.2- Once installed, add the following Certificate issuer for self-signed certificates:
xxxxxxxxxxapiVersioncert-manager.io/v1alpha2kindClusterIssuermetadata nameselfsigned-issuerspec selfSignedNow we have a cluster with multiple nodes, and we do not need to worry about certificates, the next step to running Elasticsearch is setting up storage.
Part 3: Setting up storage with Rook
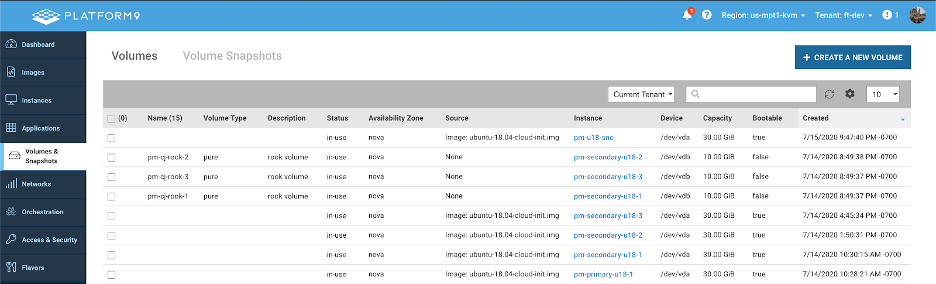
For this example, we have chosen to use Rook, an open-source CSI based on Ceph. To run Rook, you must have unformatted volumes attached to each node that are larger than 5 GB, I achieved this in our Managed OpenStack platform by creating a volume for each worker node that’s 10G in size and mounting it.
How to Add Rook CSI
I’m going to cheat here, Rook isn’t complicated to deploy, however, to keep this blog focused on EFK I’m going to refer to our Storage documentation for [auto$](/docs/kubernetes/rook-ceph-csi#Deploy Rook )
If you are looking for an overview of Rook, an installation guide and tips on validating your new Rook Cluster read through this Blog on IT NEXT ROOK.
The cluster must have a form of persistent storage available that can be accessed via a Storage Class. Failure to provide a working storage class we cause the deployment to fail. |
Now the fun part, let’s get Elasticsearch and Kibana running, then direct our Fluentd output into Elasticsearch.
Part 4: Deploy Elasticsearch
The catch with all helm charts is ensuring that you configure it for your environment using the values.yaml file and by specifying the version, namespace, and release or the name of the deployment.
The chart, available versions, instructions from the vendor, and security scan results can all be found at Artifacthub.io.
To deploy the chart, you will need to create a values.yaml file (I called mine elastic-values.yaml). To ensure Helm can access the yaml file, either provide the absolute path or have your terminal session in the directory where the values.yaml file is located.
To ensure your deployment runs, ensure the following values are in line with the defaults.
xxxxxxxxxxclusterName"elasticsearch"protocolhttphttpPort9200transportPort9300To make life a little easier, not advised for production, make the following additions to your values.yaml file.
xxxxxxxxxxantiAffinity"soft"resourcesrequests cpu"100m" memory"1500M"limits cpu"1000m" memory"1500M"esJavaOpts"-Xmx1024m -Xms1024m"replicas1minimumMasterNodes1To use the Rook storage, add the following to the values.yaml file.
Ensure the storage class name matches your implementation. |
xxxxxxxxxxvolumeClaimTemplate accessModes "ReadWriteOnce" storageClassName"rook-ceph-block" resources requests storage1GiOnce your file is set up, save it, and then deploy the chart.
xxxxxxxxxx$ helm repo add elastic https://helm.elastic.coxxxxxxxxxx$ helm install my-elasticsearch elastic/elasticsearch \ --namespace monitoring-demo \ --version 7.7.1 \ -f elastic-values.yamlThe above commands will install the 7.7.1 release of elastic into the monitoring-demo namespace using the configuration parameters defined in the elastic-values.yaml file.
Part 5: Deploy Kibana
Deploying Kibana is very similar to Elasticsearch, you will need a values.yaml file, I used a file named kibana-values.yaml. For this demo, we used a NodePort to expose the Kibana UI and to accomplish this we modified the default values.yaml with the following settings.
xxxxxxxxxxservice typeNodePort port5601 nodePort31000 labels annotationsDo not change elasticsearchHosts unless you modified the elastic-values.yaml file. By default, the values.yaml file contains:
xxxxxxxxxxelasticsearchHostshttp//elasticsearch-master9200The port 9200 is the default port and elasticsearch-master is the default Elasticsearch deployment.
The chart, available versions, instructions from the vendor and security scan results can also all be found at Artifacthub.io.
To deploy Kibana, run the following command:
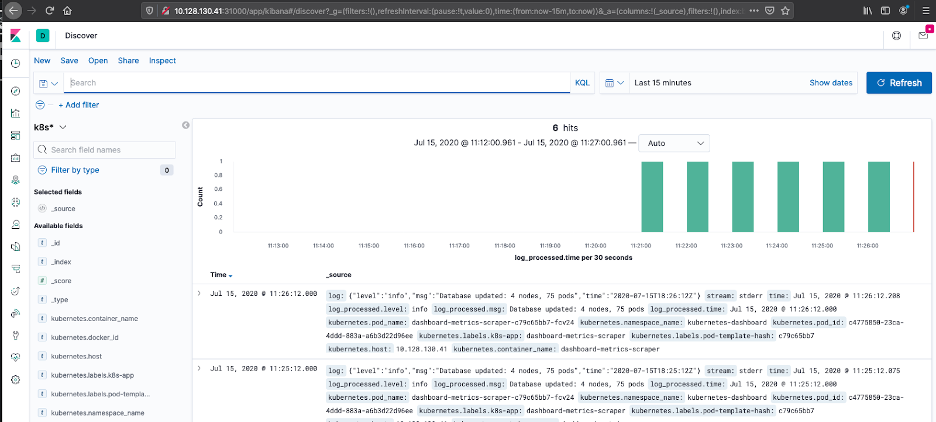
xxxxxxxxxx$ helm install my-kibana elastic/kibana \ --namespace monitoring-demo \ --version 7.7.1 \ -f kibana-values.yamlOnce deployed, we can confirm both Kibana and Elasticsearch are running by navigating to the Kibana UI in the browser of your choice. Our cluster is running on 10.128.130.41 and the NodePort is 31000, as specified in the values.yaml file, i.e. http://10.128.130.41:31000/app/kibana#/.
Now we are ready to connect Fluentd to Elasticsearch, then all that remains is a default Index Pattern.
Part 6: Configure Fluentd
The Platform9 Fluentd operator is running, you can find the pods in the pf9-logging namespace. What we need to do now is connect the two platforms; this is done by setting up an Output configuration.
You will need to place the configuration below in a yaml file and apply it to your cluster. Please note, you will need to adjust the user, password, index_name and importantly the URL.
The URL is an important piece, if this isn’t correct the data cannot be forwarded into Elasticsearch, the syntax is as follows:
xxxxxxxxxxhttp://<elastic-cluster>.<namespace>.<access-definition>If you have followed this example using the same names, no other changes are needed.
xxxxxxxxxxapiVersionlogging.pf9.io/v1alpha1kindOutputmetadata namees-objstorespec typeelasticsearch paramsnameurl valuehttp//elasticsearch-master.monitoring-demo.svc.cluster.local9200nameuser value:myelasticusernamepassword valuemygreatpasswordnameindex_name valuek8s-prdsjcmon01-fluentdUse kubectl to apply the yaml file.
Once the file has been applied, Fluentd will start to forward data to Elasticsearch, wait a few minutes and then refresh the Kibana UI and you will be able to go through the process of setting up the first index pattern.
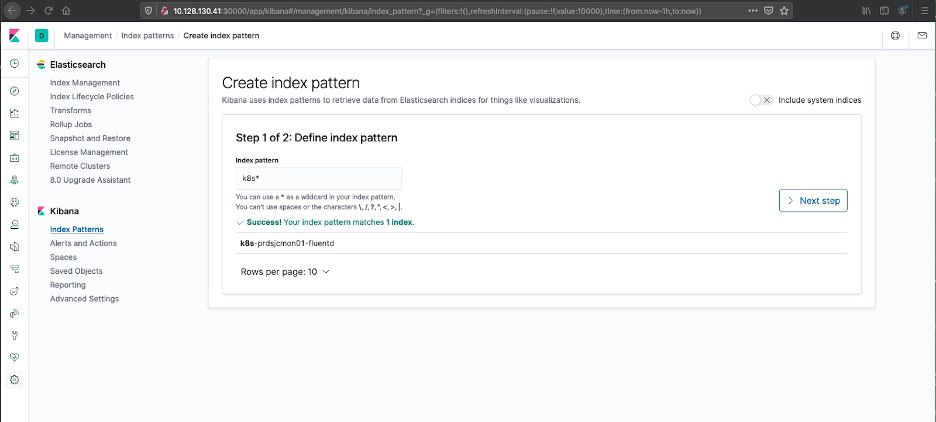
Setting up an Index Pattern is a two-step process. First, you need a regular expression to match the inbound data from Fluentd, this needs to match the index_name value, the next step is to identify the method Elasticsearch should use to manage log time stamps.
- Setting up an Index Pattern - Define Index Pattern
- Setting up an Index Pattern - Configure Settings
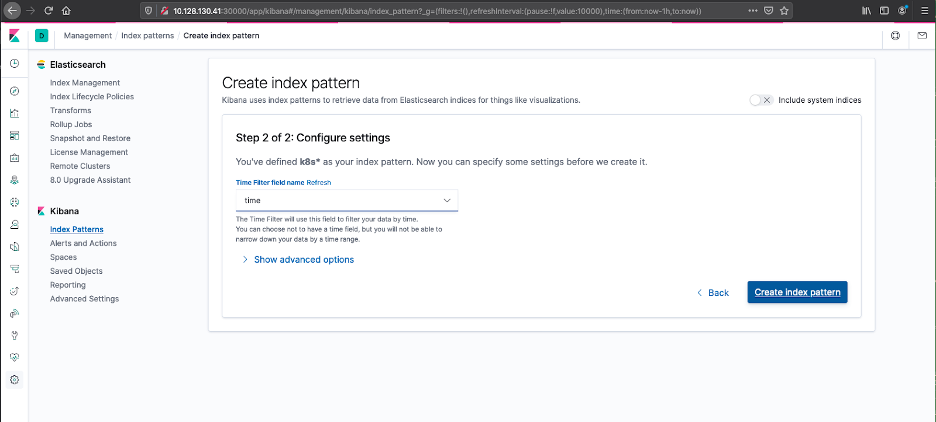
- Once the index pattern has been configured, we can use the explorer dashboard to view the log files.