Pods
The 'Pods' menu is designed to provide a comprehensive view into each pod running on your Kubernetes clusters. This page enables you to debug any issues associated with a running pod, to see all of its information, get to the containers that are part of the pod, view container logs, view all of its events etc.
To access this page, go to the Workloads menu option, then click on 'Pods' .
On this page, you can create a new Pod by clicking on the 'Add Pod' button. Or you can view all existing pods using the grid view. In the grid view, you can select the Kubernetes cluster and namespace that you want to view all the pods for. You can search for a running pod by using the search bar at the top of the grid, and specifying a text phrase that will appear in the pod name or any of the pod's properties.
Clicking on the 'Refresh' button will refresh the grid, while clicking on the 'Customize' button allows you to customize the columns you'd like to see in the grid view.
Here is the default list of columns displayed in the grid view.
- Name – The name of the pod
- Cluster – The cluster it is attached to
- Namespace – The namespace it operates with
- Links – This opens the Kubernetes dashboard to view advanced pod information
- Labels – This is the field that the user defines for the pod
- Containers – Shows the name of the containers within the pod and offers a link to View Container Logs
- Status – This field show whether the pod is in a Pending, Running, Succeeded, Failed, or Unknown state
- Status Message – Shows any messages related to the condition of the pod
- Node IP – The IP of the node
- Created Date – The pod creation date

Information about each pod can be found by clicking on the links contained within the defined pod area. These include the Name of the pod, Links element, and the Containers fields.
Pod Details View
Clicking on the highlighted link associated with the pod name opens a new page with detailed information about that pod. The page is divided into several tabs.
Overview
In the overview tab, you can see the name of the Pod, its Quality of Service (or QoS) class, and its age. In the Utilization section, you can see the CPU, Memory, Usage stats, Requested memory, and Limits.

Further down, it shows the name of the pod, the number of restarts, the average CPU usage, the average memory usage, its status, and any status messages available. Below that, we are shown the assigned label and any annotations for the pod. Lastly, any attached services are displayed.
In the lower sections we see associated ingress points, config maps, or PVC's.
Events
Selecting the events tab shows us any specific documented pod related issues, should they occur. The available fields include the following information.
- Reason – The cause of the problem
- Type – Lists the nature of the event
- Object – The generated response to changes that have occurred
- Kind – Details the type of pod
- Message – The communication that is generated by the event
- Time – The time the event occurred
Logs
The Logs page provides a quick overview of the most recent event noted in the logs.
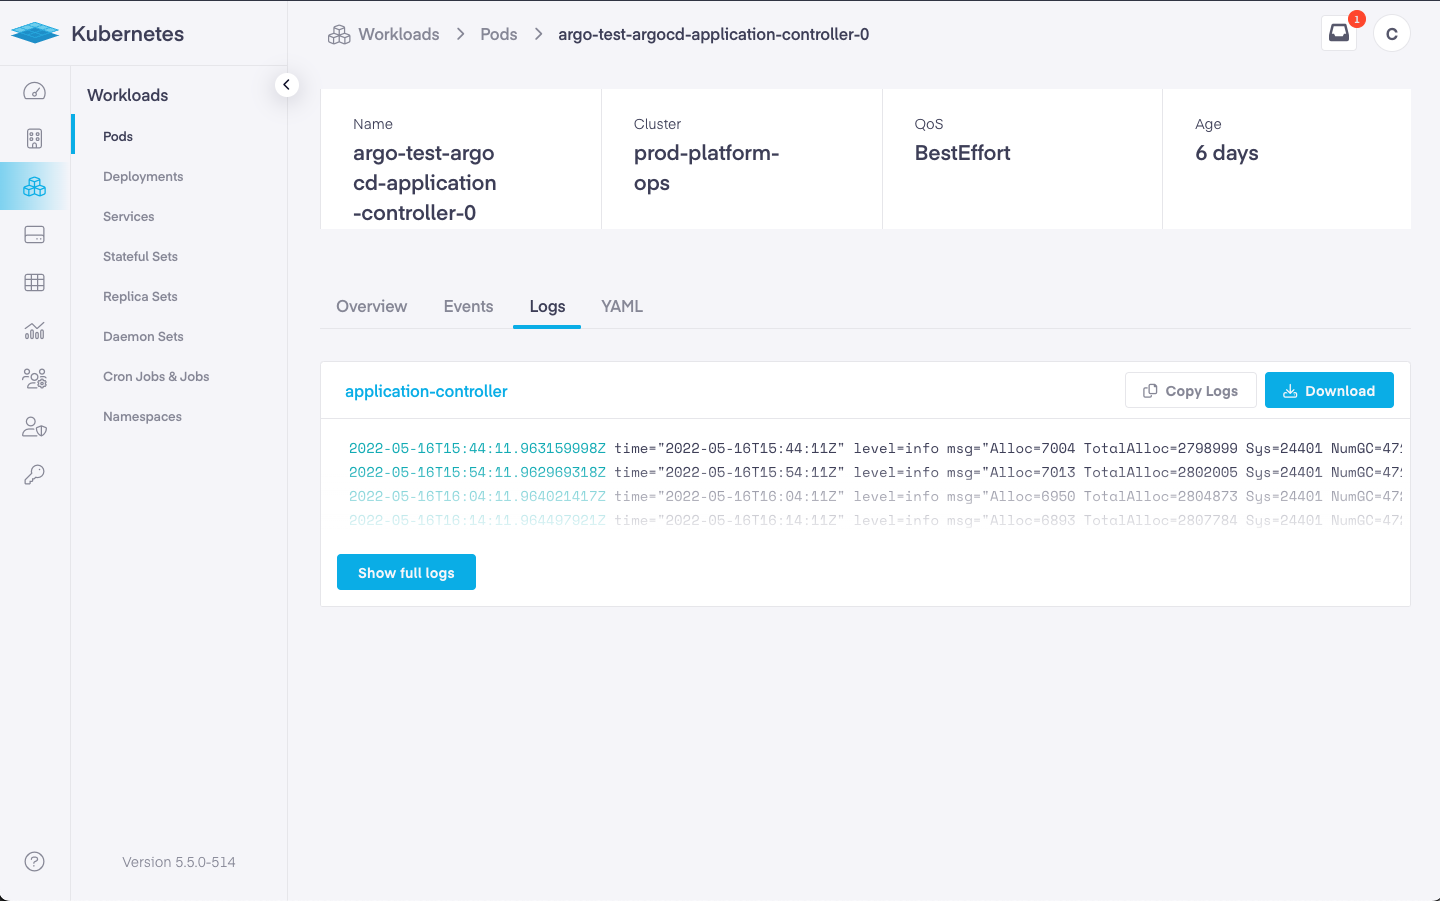
Clicking on the View Full Logs link opens a new page to review the full logs.
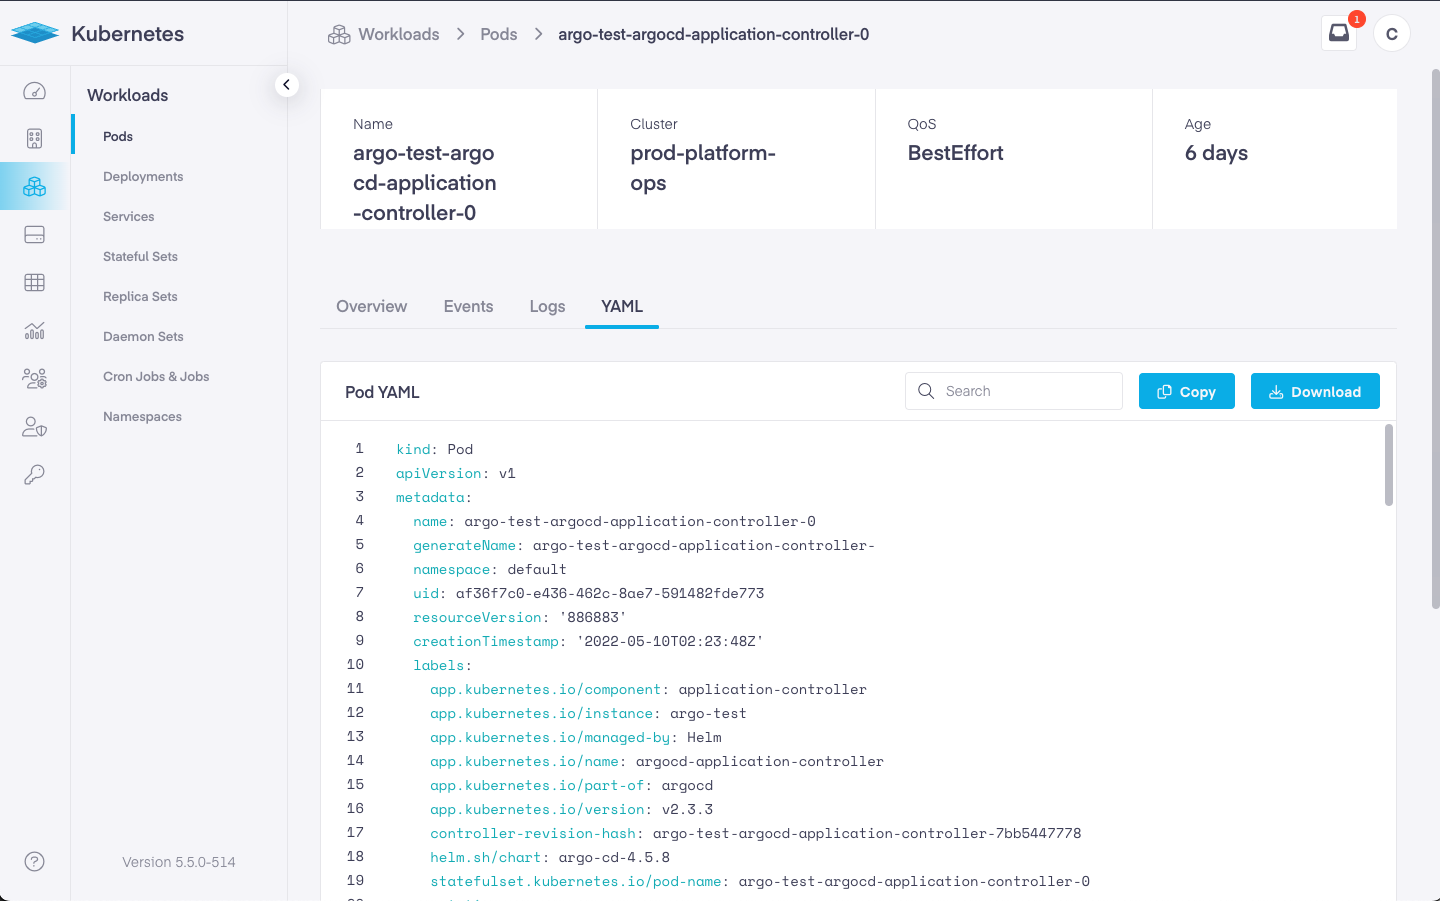
YAML
The YAML tab allows users to modify, copy, or search the file for a specific term or preference.