Monitoring Alarms
To view any existing monitoring alarms, go to the Monitoring > Alarms. Next, select the cluster, status, and severity to see any available alarm related information. Initially, we see the name of the cluster, the type of cluster, connection status of the nodes in the cluster, whether the Platform9 components are healthy, and if the API server is responding for all nodes. Additionally, it provides links to Grafana, the kubernetes dashboard and the kubeconfig download config. Below this, a graphical overview of the alarms is seen, which provides a bird's-eye view of events. Clicking on the dropdown tabs shows the status of the alarm (All, Active, Suppressed, or Closed), the severity (Warning, Critical, or Fatal), and the overall timeframe of the alarms.
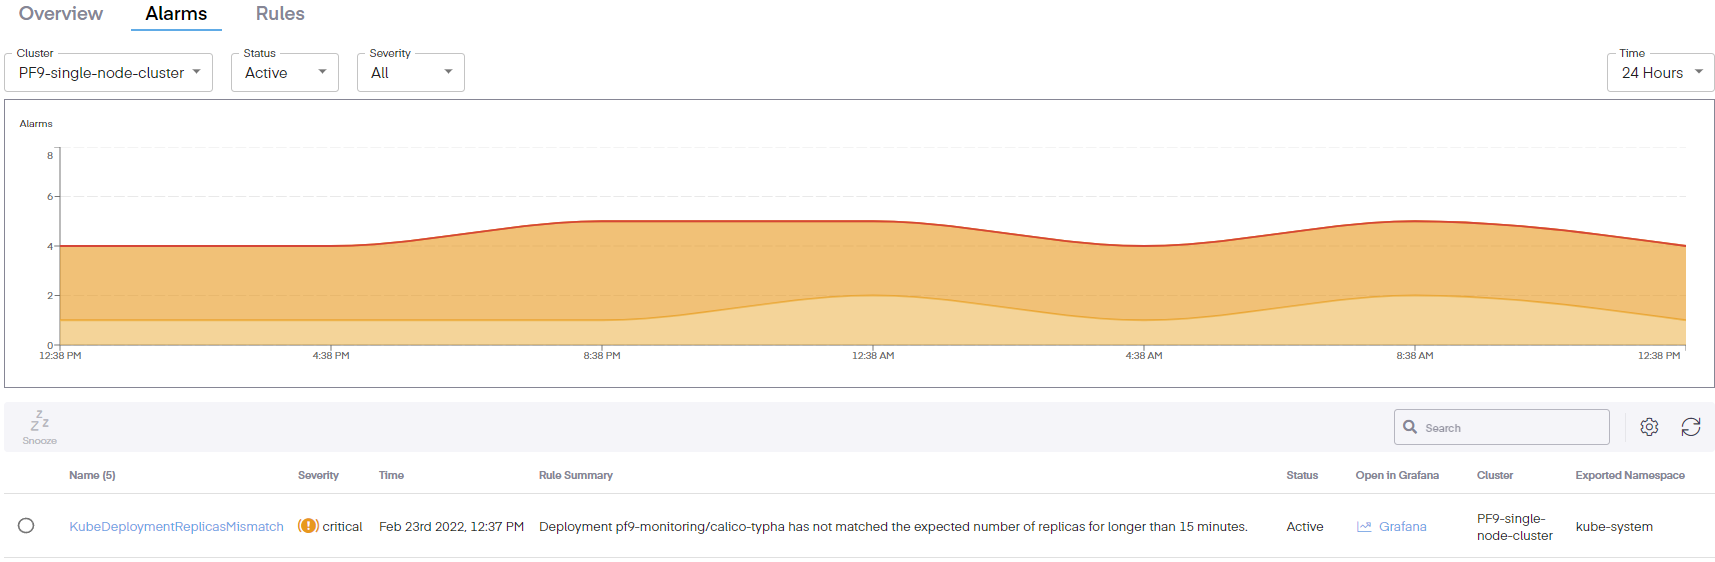
The columns can also be edited to include the following information.
- Fingerprint – A unique alert identifier
- Name – The name of the rule
- Severity – The gravity of the issue
- Time – Then the issue began
- Rule Summary – a short abstract or synopsis of the issue
- Status – Shows the current condition of the issue
- Open in Grafana – Provides a link to the Grafana dashboard to view the issue in that interface
- Cluster – Defines the cluster where the issue occurred
- Exported Namespace – The namespace where the event occurred
- Starts At – The beginning time of the incident
- Ends At – The ending time of the incident
Alarm Graph
Additionally, the graphical representation can be viewed that defines the monitoring timeframe set on the far right. Running the mouse over the graph shows the number of alarm types within a window of time.
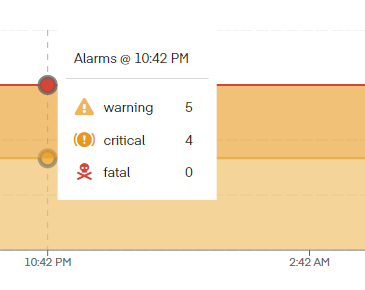
- 24-Hour Timeframe – Errors are shown in four hour blocks
- 12-Hour Timeframe – Errors are shown in two hour blocks
- 6-Hour Timeframe – Errors are shown in one hour blocks
- 3-Hour Timeframe – Errors are shown in thirty minute blocks
- 1-Hour Timeframe – Errors are shown in ten minute blocks
Editing Alarm Info
Within each alarm, the following columns can be seen, modified, or added.
- Fingerprint – This is the unique identifier for the alert
- Name – This is the name of the alert
- Severity – This shows the alert state, Warning, Critical, or Fatal
- Time – The time the alert is noted within the interface
- Rule Summary – This defines alert condition
- Status – The status shows whether the alarm event is Active, Suppressed, or Closed
- Open in Grafana – This is a link to open the Grafana dashboard and view the alert
- Cluster – This defines which cluster the event occurred on
- Exported Namespace – This shows the associated namespace location of the alert
- Starts At – This defines the start time of the observed event
- Ends At – This defines the end time of the observed event
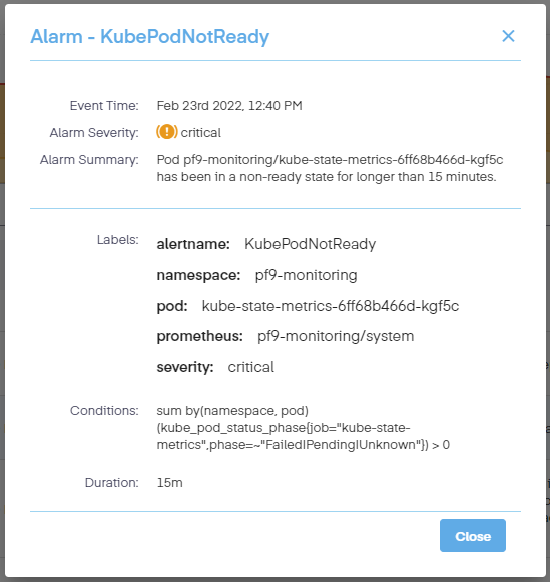
Alarm Info
Clicking the link for an individual alarm brings up a new screen providing specific info about that alarm.
Snoozing Alarms
To silence an alarm, select the radio box next to the specific alarm, and click on the Snooze icon located below the Alarm Graph. This brings up a small screen which allows the user to select a timeframe to snooze the alarm for. This can be set for:
- 15 Minutes
- 30 Minutes
- 1 Hour
- 4 Hours
- 12 Hours
- 24 Hours
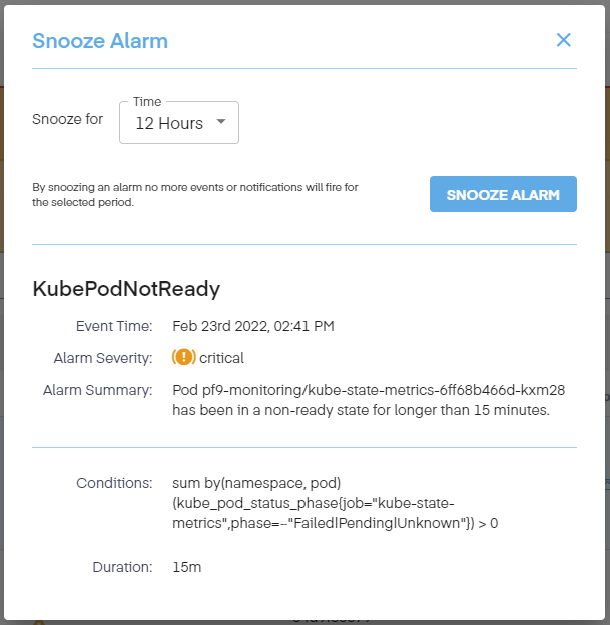
This also defines the name of the alert type, the time of the event, its severity, a summary of the alarm, the conditions of the alarm, and the duration.