Cluster Alarms
There are two methods to view the alarms, the first is to go to Infrastructure > Clusters and then click the radio button next to the cluster name, then click Details. The second is to click the link on the cluster name. This opens a new window where we can now see the Alarms tab. It shows Kubernetes monitoring, alarm visibility and a clear understanding of what is happening inside a Kubernetes cluster and its associated applications.
Initially, we see the name of the cluster, the type of cluster, connection status of the nodes in the cluster, whether the Platform9 components are healthy, and if the API server is responding for all nodes. Additionally, it provides links to Grafana, the kubernetes dashboard and the kubeconfig download config. Moreover, a graphical overview of the alarms is seen, which provides a bird's-eye view of events. Clicking on the dropdown tabs shows the status of the alarm (All, Active, Suppressed, or Closed), the severity (Warning, Critical, or Fatal), and the overall timeframe of the alarms.
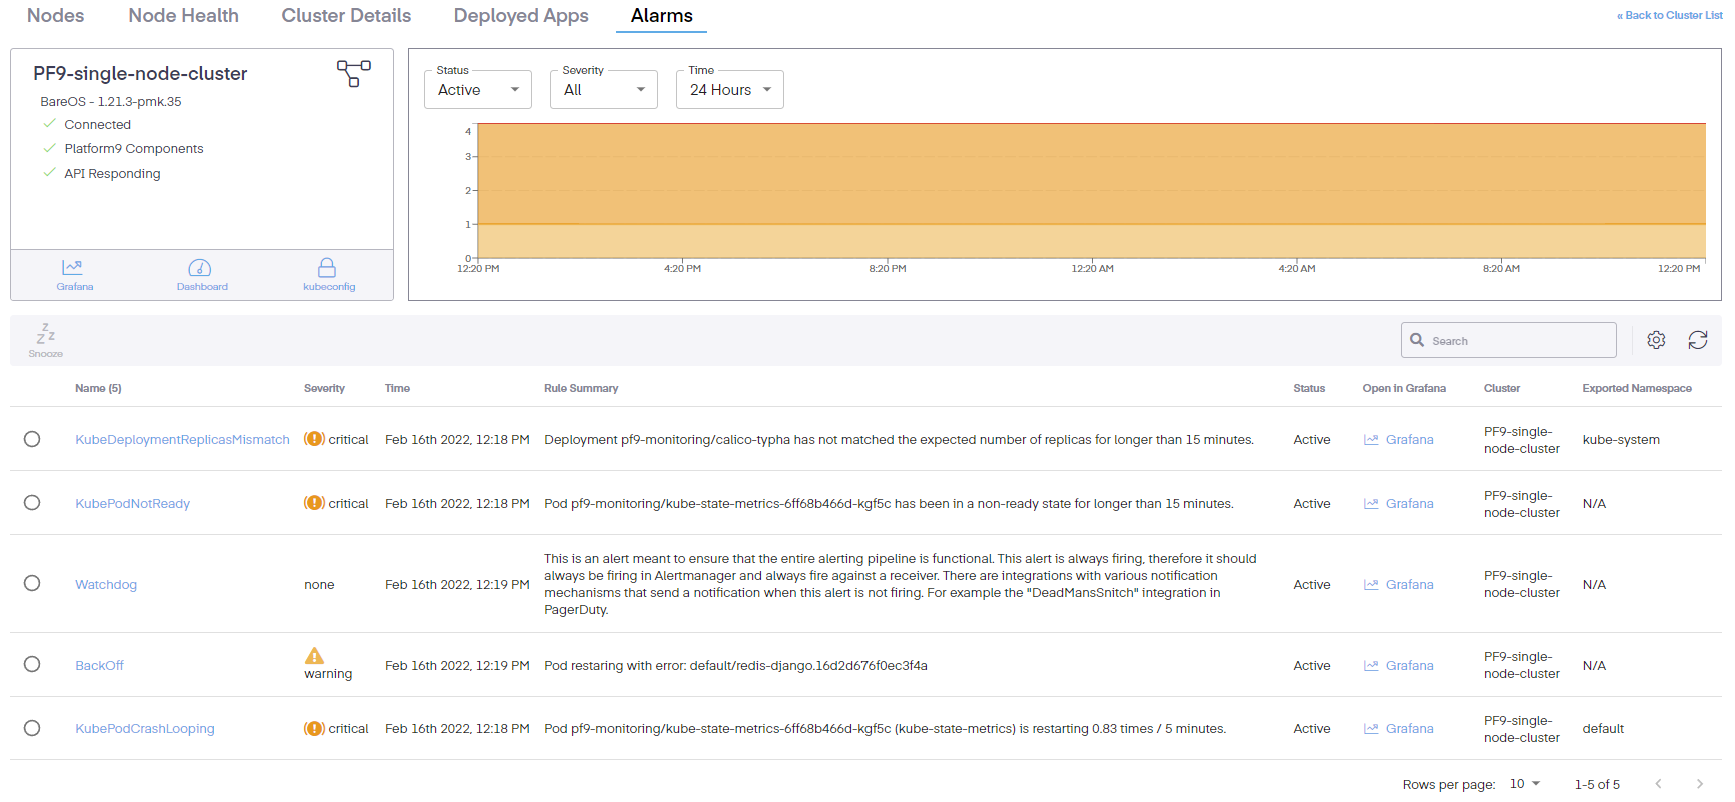
The columns can also be edited to include the following information.
- Fingerprint – A unique alert identifier
- Name – The name of the rule
- Severity – The gravity of the issue
- Time – Then the issue began
- Rule Summary – a short abstract or synopsis of the issue
- Status – Shows the current condition of the issue
- Open in Grafana – Provides a link to the Grafana dashboard to view the issue in that interface
- Cluster – Defines the cluster where the issue occurred
- Exported Namespace – The namespace where the event occurred
- Starts At – The beginning time of the incident
- Ends At – The ending time of the incident
Clicking on an individual alarm bring up a new pop-up pane which details even more info.
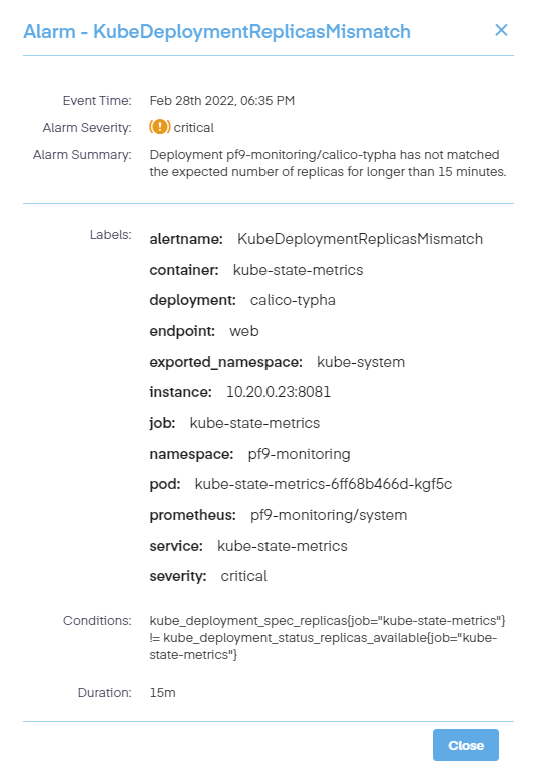
These details include the following information.
- The name of the alarm
- Its severity
- A short summary of the alert issue
- Any labels that are applied
- The conditions of the alarm
- The length of time or duration of the event