Services
The Services page is designed to provide a comprehensive view into each service running on your Kubernetes clusters. This page is your one stop shop for debugging any issues associated with a running services, to see and access all pods that are part of the service, quickly get to the containers and container logs for the pods, view all events for the service, access logs, etc.
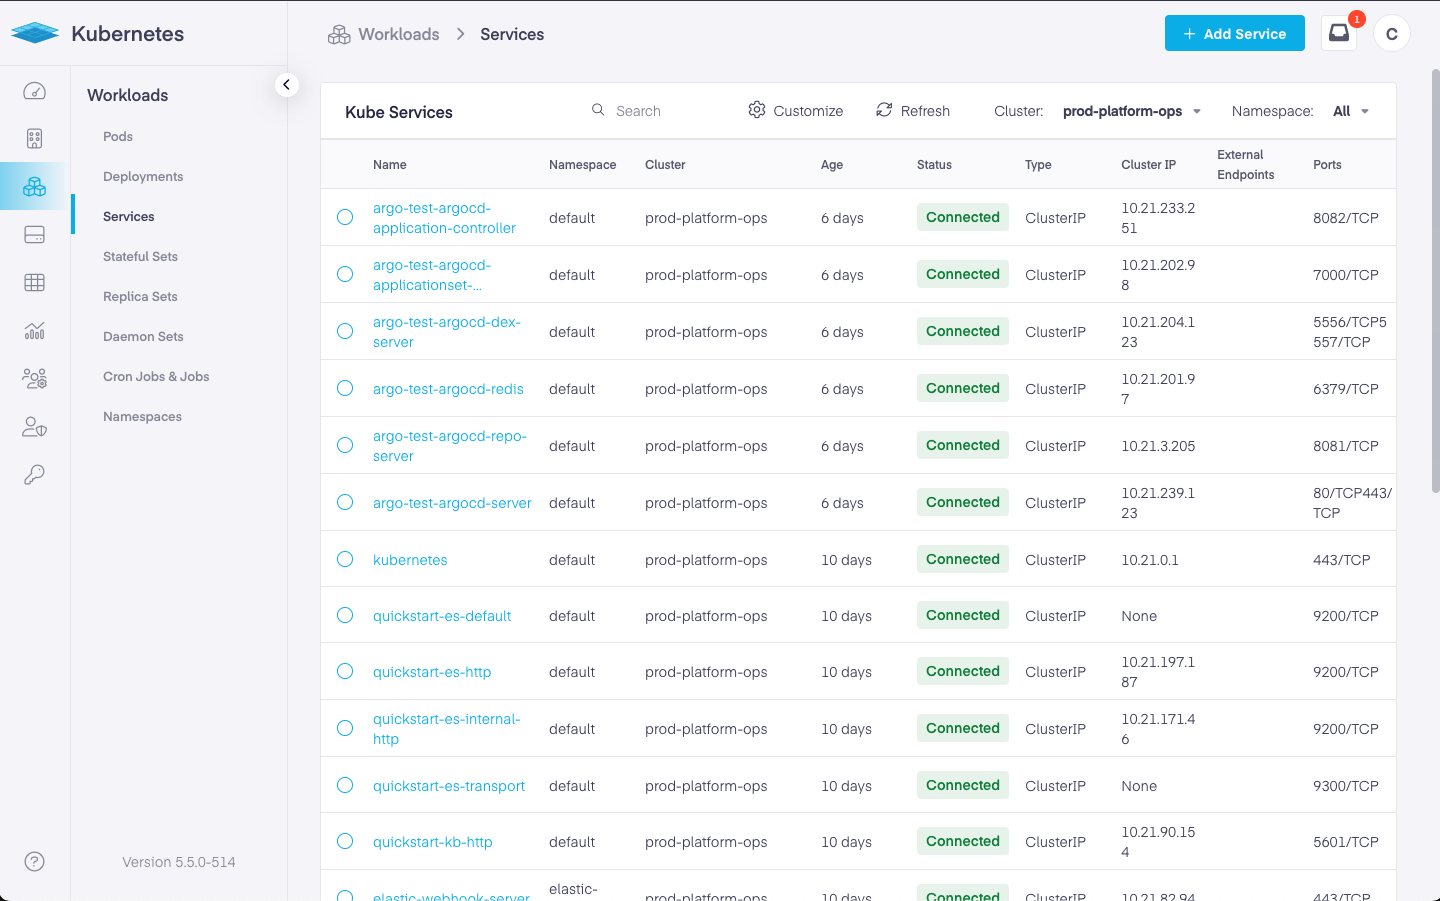
To access this page, go to the Workloads menu option, then click on 'Services' .
On this page, you can create a new service by clicking on the 'Add Service' button. Or you can view all existing services using the grid view. In the grid view, you can select the Kubernetes cluster and namespace that you want to view services for. You can search for a running service by using the search bar at the top of the grid, and specifying a text phrase that will appear in the service name or any of the service properties.
Clicking on the 'Refresh' button will refresh the grid, while clicking on the 'Customize' button allows you to customize the columns you'd like to see in the grid view.
The services grid view has the following columns:
- Name – The name of the pod
- Status – This field shows the service state
- Type – Specifies the type of service. The default is ClusterIP
- Cluster – The Kubernetes cluster this service is attached to
- Namespace – The Kubernetes namespace this service operates in
- Links – This opens the Kubernetesdashboard to view advanced pod information
- Labels – This is the field that the user defines for the pod
- Selectors – A user-defined label utilized in searching for a service
- Cluster IP – The main IP of the Kubernetes cluster this service belongs to
- External Endpoints – Notes any external IPs
- Ports – Defines any associated ports
- Created Date – The pod creation date
You can click on the individual service's name to deep dive into that service and see all the associated details.
Service Details View
This view is designed to provide a deep dive into the given service. The view is divided into several tabs.
Overview
On the overview tab, you will see general information for the service. This includes its name, cluster, kind, namespace, type, clusterIP, and age. On the right, we see CPU and memory utilization info and the associated limits. Below that, we see the selectors and linked pods.
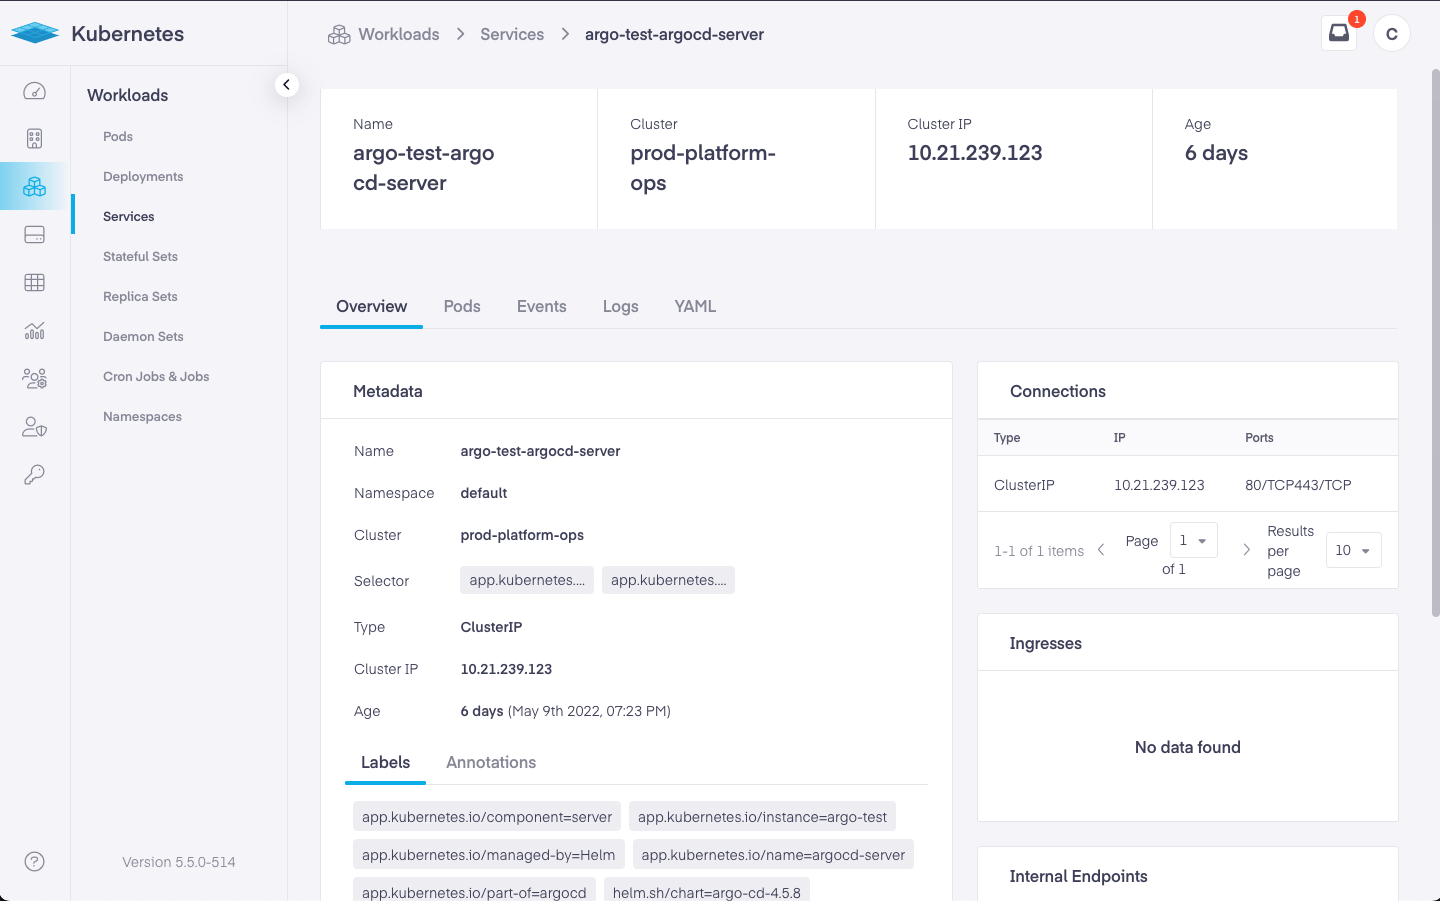
Further down we see the labels, annotations, connection details, internal endpoints, external endpoints, and ingresses.
Events
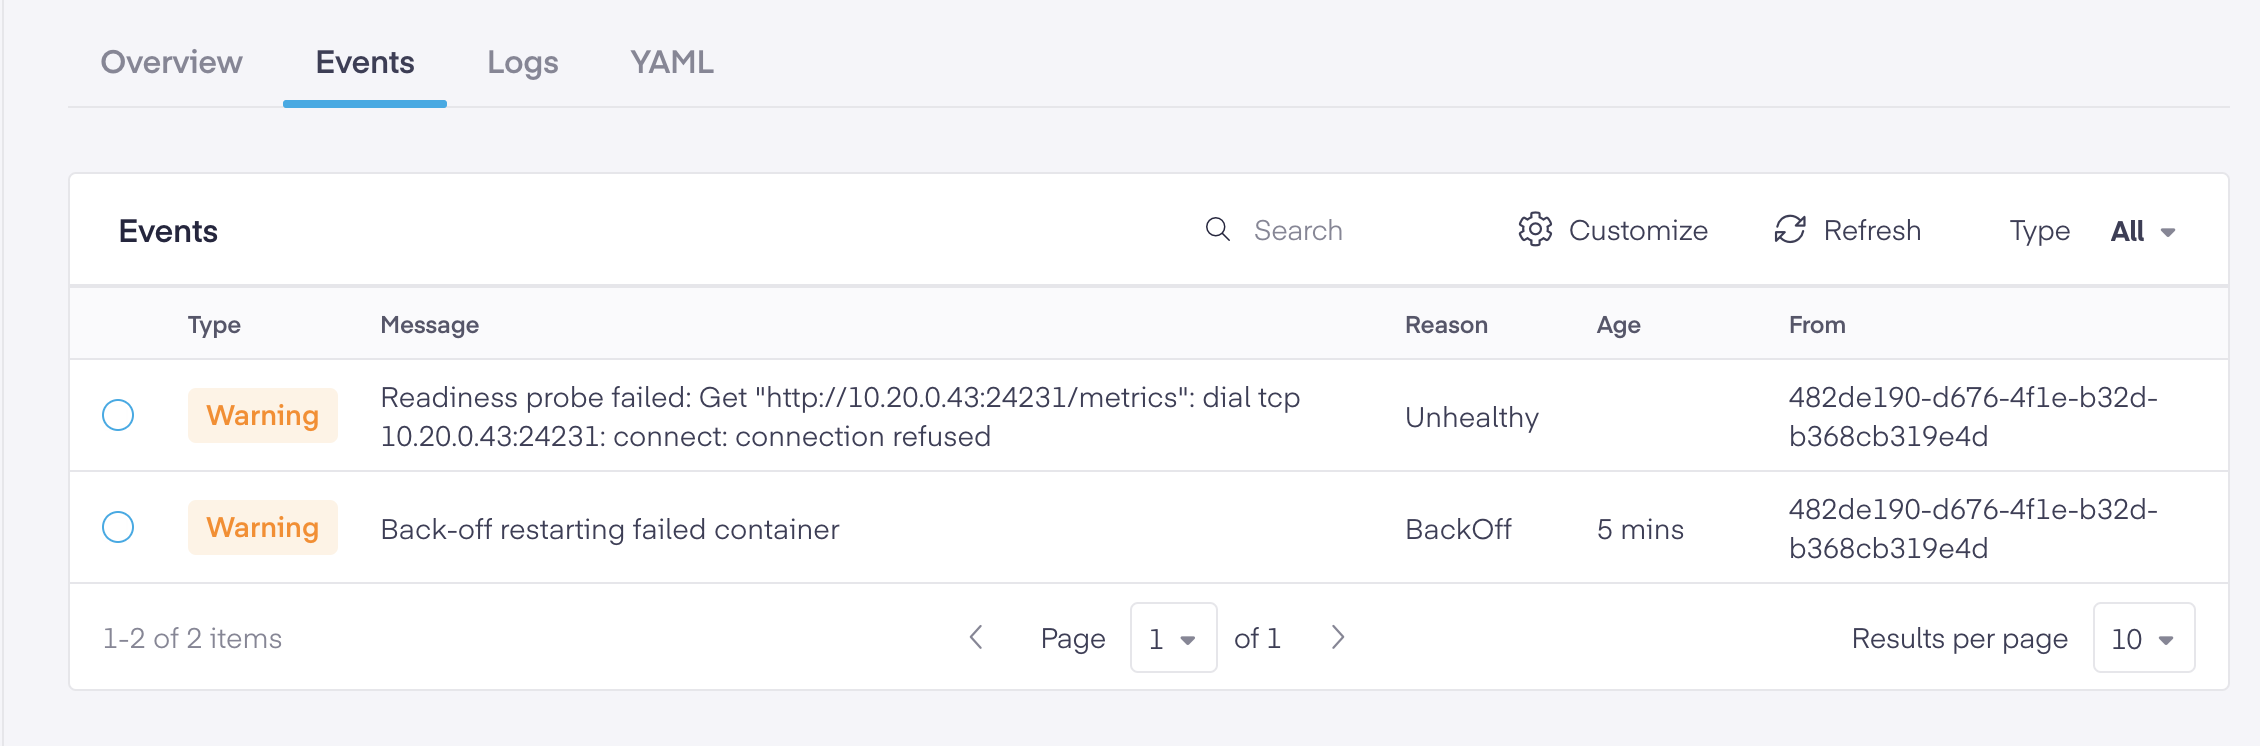
Any service related events and messages appear on the Events tab. Here you can choose the event type (warning, error, or normal), search for an event, click the circular icon to refresh the page, or click the gear icon to choose the columns seen.
- Type – The condition which caused the event
- Message – The communication that is generated by the event
- Reason – The cause of the event
- Object – The generated response to changes that have occurred
- Kind – Details the type of service
- Time – The time the event occurred
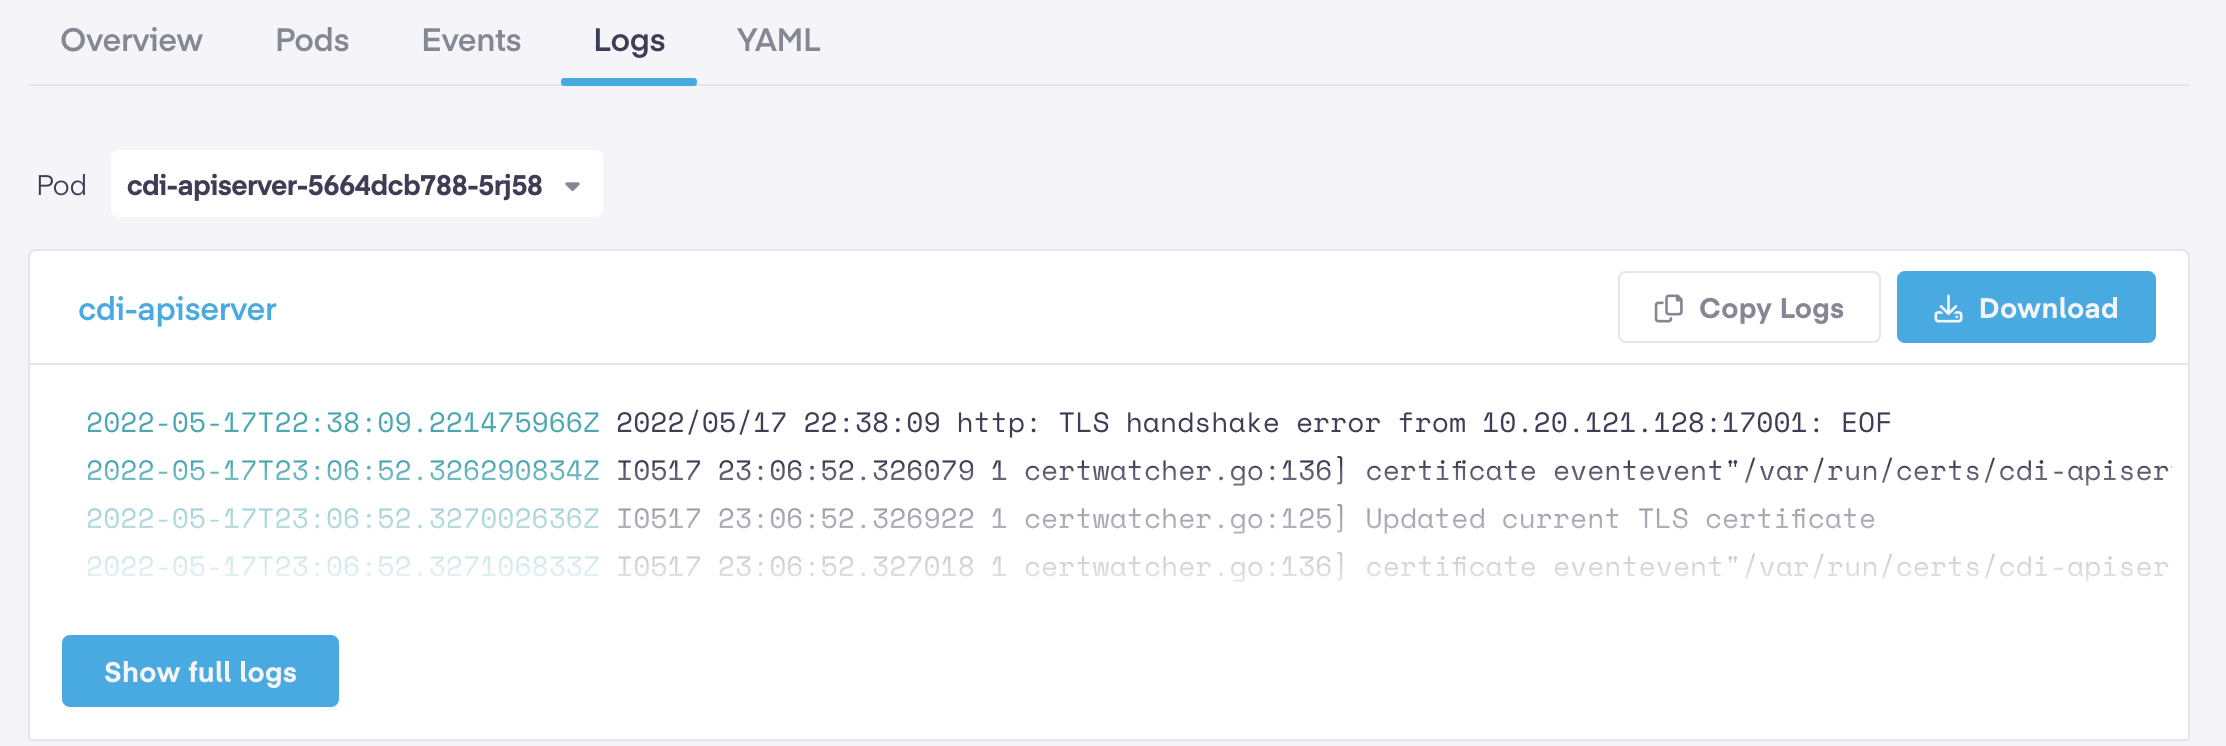
Logs
The logs tab provides easy access to logs for all pods that are part of this service. You can us the 'Pod' dropdown menu to select a specific pod to view its logs. The default view shows you a quick snippet into the latest log messages for that pod. Clicking on 'Show__Full Logs' button opens a new page to review the full logs for that pod. You can also easily copy the pod log messages or download the full log file from here.
YAML
The YAML tab allows users to modify, copy, or search the file for a specific term or preference. If changes are made, click the Save button to keep the changes or the Reset button to restore the original info.