CrashLoopBackOff
One of the first errors you may run into when launching your first container on Kubernetes is CrashLoopBackOff. This article is intended to explain what CrashLoopBackOff means, what situations can cause it, and how to troubleshoot this problem if you hit this.
What CrashLoopBackOff means
CrashLoopBackOff is a common error status of a pod that has failed to start repeatedly. When Kubernetes sees a pod fail to start or gets terminated, it tries to automatically restart the pod, based on the restart policy in the PodSpec.
By default, the PodSpec sets the restart policy to always restart on failure. In the PodSpec you can configure the restart policy to use other options: Never or OnFailure. When configured to restart, Kubernetes will attempt to restart the failed or terminated pod with a backoff delay that increases every time it restarts. In most cases, you will leave this setting set to default because you want the container to restart if it fails so that the service it is offering doesn’t become unavailable.
When a pod fails to start repeatedly, the kubelet gives up and “backs off”; hence the error status CrashLoopBackOff.
The restartPolicy applies to all containers in the Pod. restartPolicy only refers to restarts of the containers by the kubelet on the same node. After containers in a Pod exit, the kubelet restarts them with an exponential back-off delay (10s, 20s, 40s, …), that is capped at five minutes. Once a container has executed for 10 minutes without any problems, the kubelet resets the restart backoff timer for that container. |
What causes CrashLoopBackOff
There are a variety of scenarios that can result in a pod that fails to start repeatedly, leading to CrashLoopBackOff. These include:
- A pod that terminates immediately after startup. A common beginner mistake is to launch a pod that doesn’t have a real command, which would trigger an infinite restart loop. Kubernetes detects the infinite loop, and backs off.
- Insufficient resources causing a pod to fail to start. This can happen if the available memory or CPU resources are insufficient to launch the pod.
- Missing dependency (on other services, or external resources such as a database) that causes a pod to fail to start.
- An incorrectly configured Liveness probe. Kubernetes uses Liveness probes to detect if a pod is healthy, or if it needs to be restarted. However, if the probe runs before the pod is launched and ready, then it will always report the pod as being unhealthy, triggering a termination and a restart.
Troubleshooting CrashLoopBackoff
While there are many possible causes for CrashLoopBackOff, we are going to troubleshoot one caused by a pod that was started without access to a service required for the application to run.
As described in this runbook, the typical workflow will involve:
- Gather information
- Examine Events section in describe output
- Check the exit code
- Check readiness/liveness probes
- Check common application issues
Where do we start? We think there is something wrong with the pod, but we need to do some troubleshooting to figure out what is causing the issue. We will assume that kubectl has been installed and was used to deploy the pod.
Follow this Kubectl install guide if you haven't installed or configured Kubectl with your cluster. |
xxxxxxxxxx$ kubectl get podsNAME READY STATUS RESTARTS AGEclb-7969578c4b-dt7s5 0/1 CrashLoopBackOff 23 98mThis example has a single pod, with 0/1 ready, in the CrashLoopBackOff status. It has attempted to resolve the issue by restarting 23 times, over the course of 98 minutes.
Next we can run a describe on the pod to see if there is any information within Kubernetes related to why it is not running.
xxxxxxxxxx$ kubectl describe pod clb-7969578c4b-dt7s5Name: clb-7969578c4b-dt7s5Namespace: defaultPriority: 0Node: 192.168.86.71/192.168.86.71Start Time: Tue, 31 May 2022 08:50:19 -0700Labels: app=clb pod-template-hash=7969578c4bAnnotations: cni.projectcalico.org/podIP: 10.20.128.77/32 cni.projectcalico.org/podIPs: 10.20.128.77/32Status: RunningIP: 10.20.128.77IPs: IP: 10.20.128.77Controlled By: ReplicaSet/clb-7969578c4bContainers: clb: Container ID: docker://787a5c3fd19190bcda09b2c4a6433f70fd62d45ed9bd69dc06ed1a52ee853424 Image: platform9/clb:90ea4bc Image ID: docker-pullable://platform9/clb@sha256:5778e7befc2af0172a9545835266985e6305b75ba0a719f4b24fcab2f8bd857c Port: 80/TCP Host Port: 0/TCP State: Waiting Reason: CrashLoopBackOff Last State: Terminated Reason: Error Exit Code: 1 Started: Tue, 31 May 2022 10:29:08 -0700 Finished: Tue, 31 May 2022 10:29:09 -0700 Ready: False Restart Count: 24 Environment: <none> Mounts: /var/run/secrets/kubernetes.io/serviceaccount from kube-api-access-s9vdf (ro)Conditions: Type Status Initialized True Ready False ContainersReady False PodScheduled True Volumes: kube-api-access-s9vdf: Type: Projected (a volume that contains injected data from multiple sources) TokenExpirationSeconds: 3607 ConfigMapName: kube-root-ca.crt ConfigMapOptional: <nil> DownwardAPI: trueQoS Class: BestEffortNode-Selectors: <none>Tolerations: node.kubernetes.io/not-ready:NoExecute op=Exists for 300s node.kubernetes.io/unreachable:NoExecute op=Exists for 300sEvents: Type Reason Age From Message ---- ------ ---- ---- ------- Warning BackOff 2m11s (x462 over 102m) kubelet Back-off restarting failed containerDescribe will give us more detailed information about the pod. We can see the image repository and name, the status of the pod, and at the end we can see Events which may provide additional details about what is causing the error. In this case it is only showing that the pod had a warning with reason Back-off and that it is continuously restarting.
At this point we will want to take a look at the logs from the container to see if there is an issue with our application. We can do this with kubectl logs PodName .
xxxxxxxxxx$ kubectl logs clb-7969578c4b-dt7s5Example app listening on port 3000!/app.js:76 allAgesStreams = bodyJSON.streams.filter(function(d) { ^ TypeError: Cannot read property 'filter' of undefined at Request._callback (/app.js:76:39) at Request.self.callback (/node_modules/request/request.js:186:22) at emitTwo (events.js:126:13) at Request.emit (events.js:214:7) at Request.<anonymous> (/node_modules/request/request.js:1163:10) at emitOne (events.js:116:13) at Request.emit (events.js:211:7) at IncomingMessage.<anonymous> (/node_modules/request/request.js:1085:12) at Object.onceWrapper (events.js:313:30) at emitNone (events.js:111:20)statusCode: 400It looks like there are issues within the application. It starts and binds to port 3000, but then the application fails because it’s unable to get information from another service that is not running in our cluster.
This is a basic example however the troubleshooting steps would be the same for diagnosing issues with CrashLoopBackOff.
Simplifying CrashLoopBackOff Troubleshooting with the Platform9 UI and Monitoring
How can this be made easier for a developer who may not want to use the CLI? Platform9 visualizes all of this information within the Dashboard. With the 5.5 release we have added additional information and insights into each of the workload types.
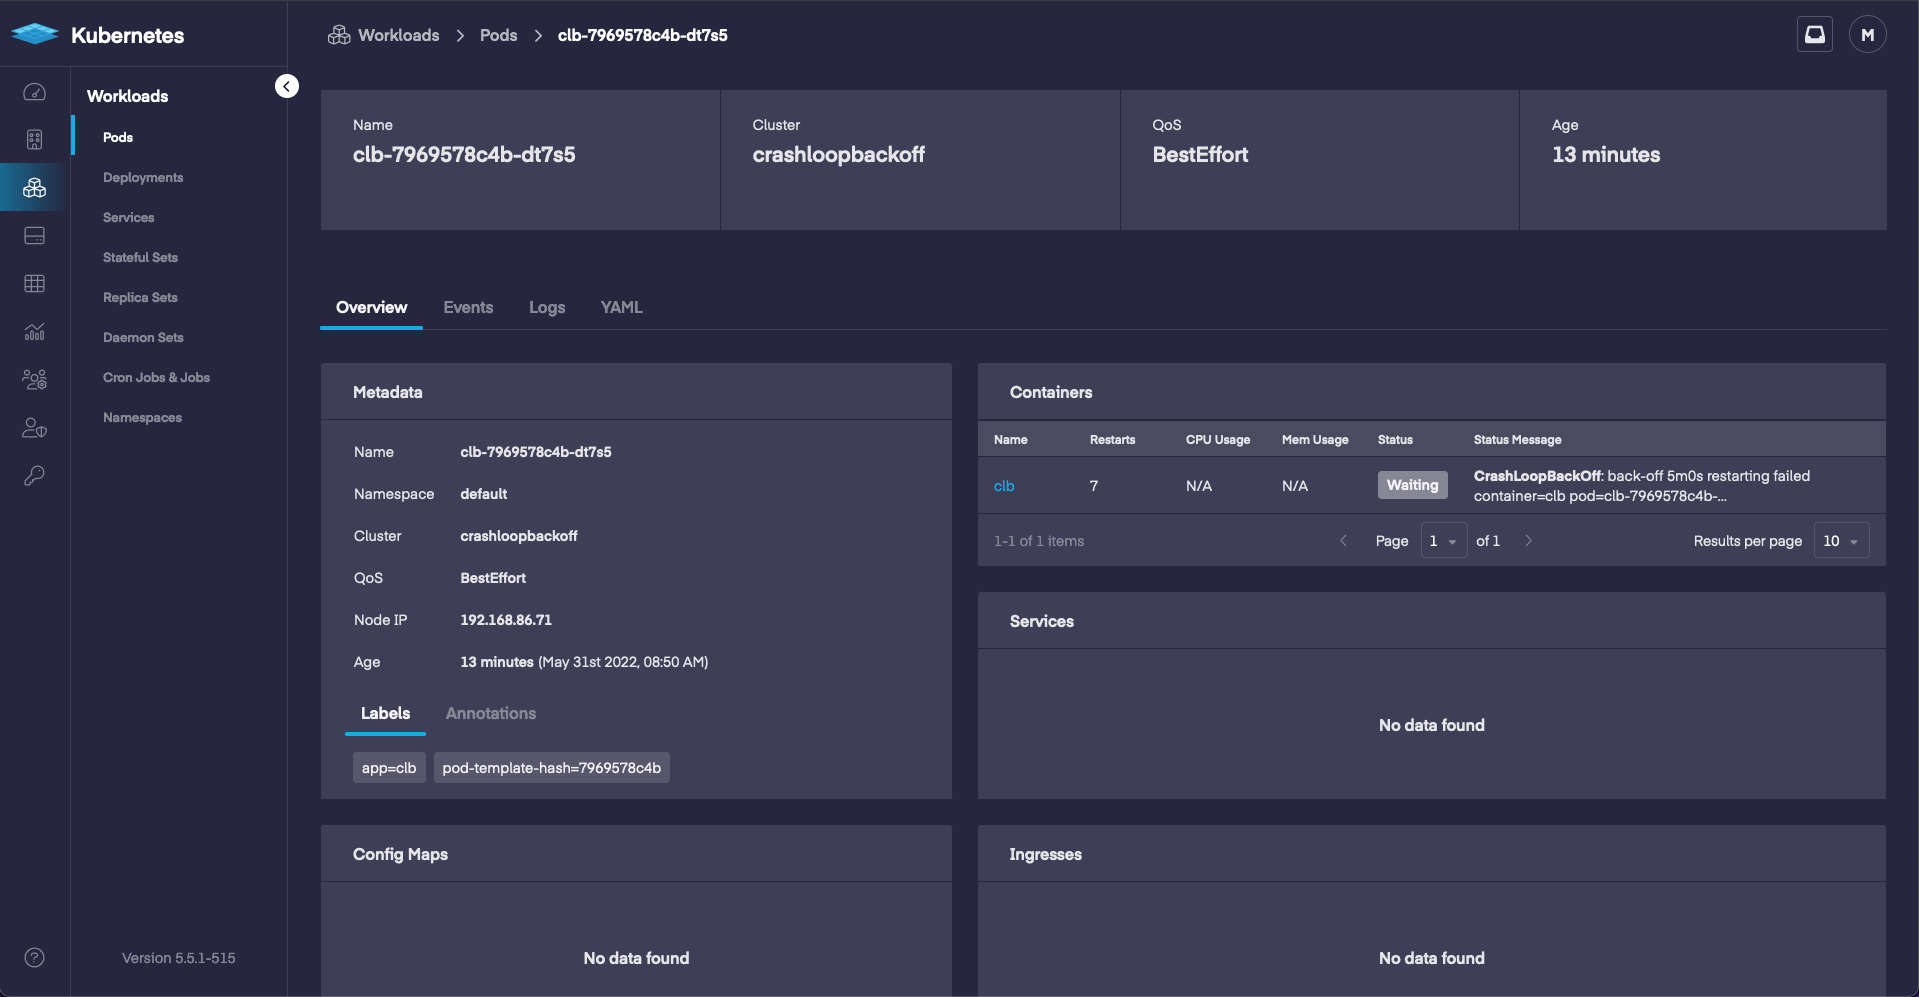
First we will take a look at Pods in the UI. This will give us general information, but may also include useful troubleshooting information in the Status Message. A quick look at the Pod and we already see something wrong, it’s in the CrashLoopBackOff status.

If we click the pod then we can drill down into more information about it.
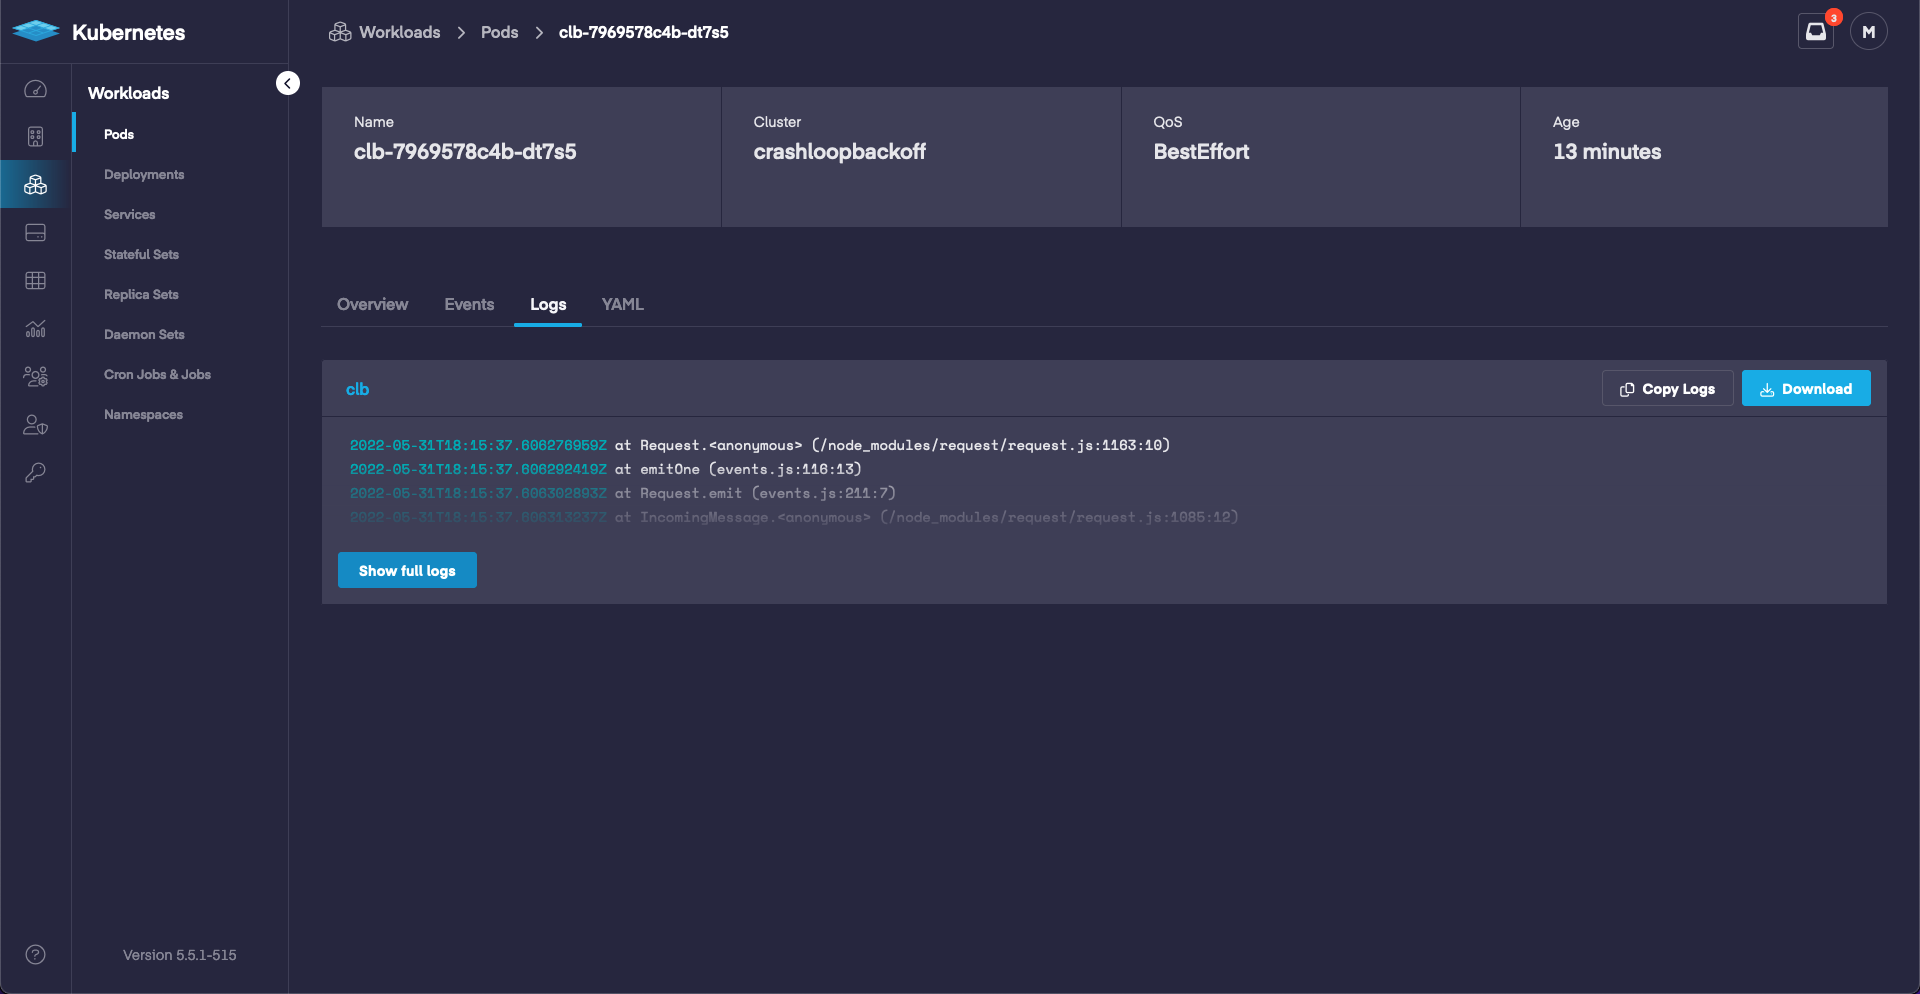
When we take a look at events we can see a warning message and the current status. The warning lets us know there’s an issue, so next we’ll want to take a look at the logs.

According to the logs we can see that the pod launches, binds to port 3000, then runs into issues. This information is the same as what we were able to see with the CLI, however instead of running a few commands we were able to view it in the Dashboard.

Monitoring gives us the ability to check on the status of our cluster and see errors related to our pod, or other pods in the cluster. If we check out the current errors we are able to see a BackOff error.
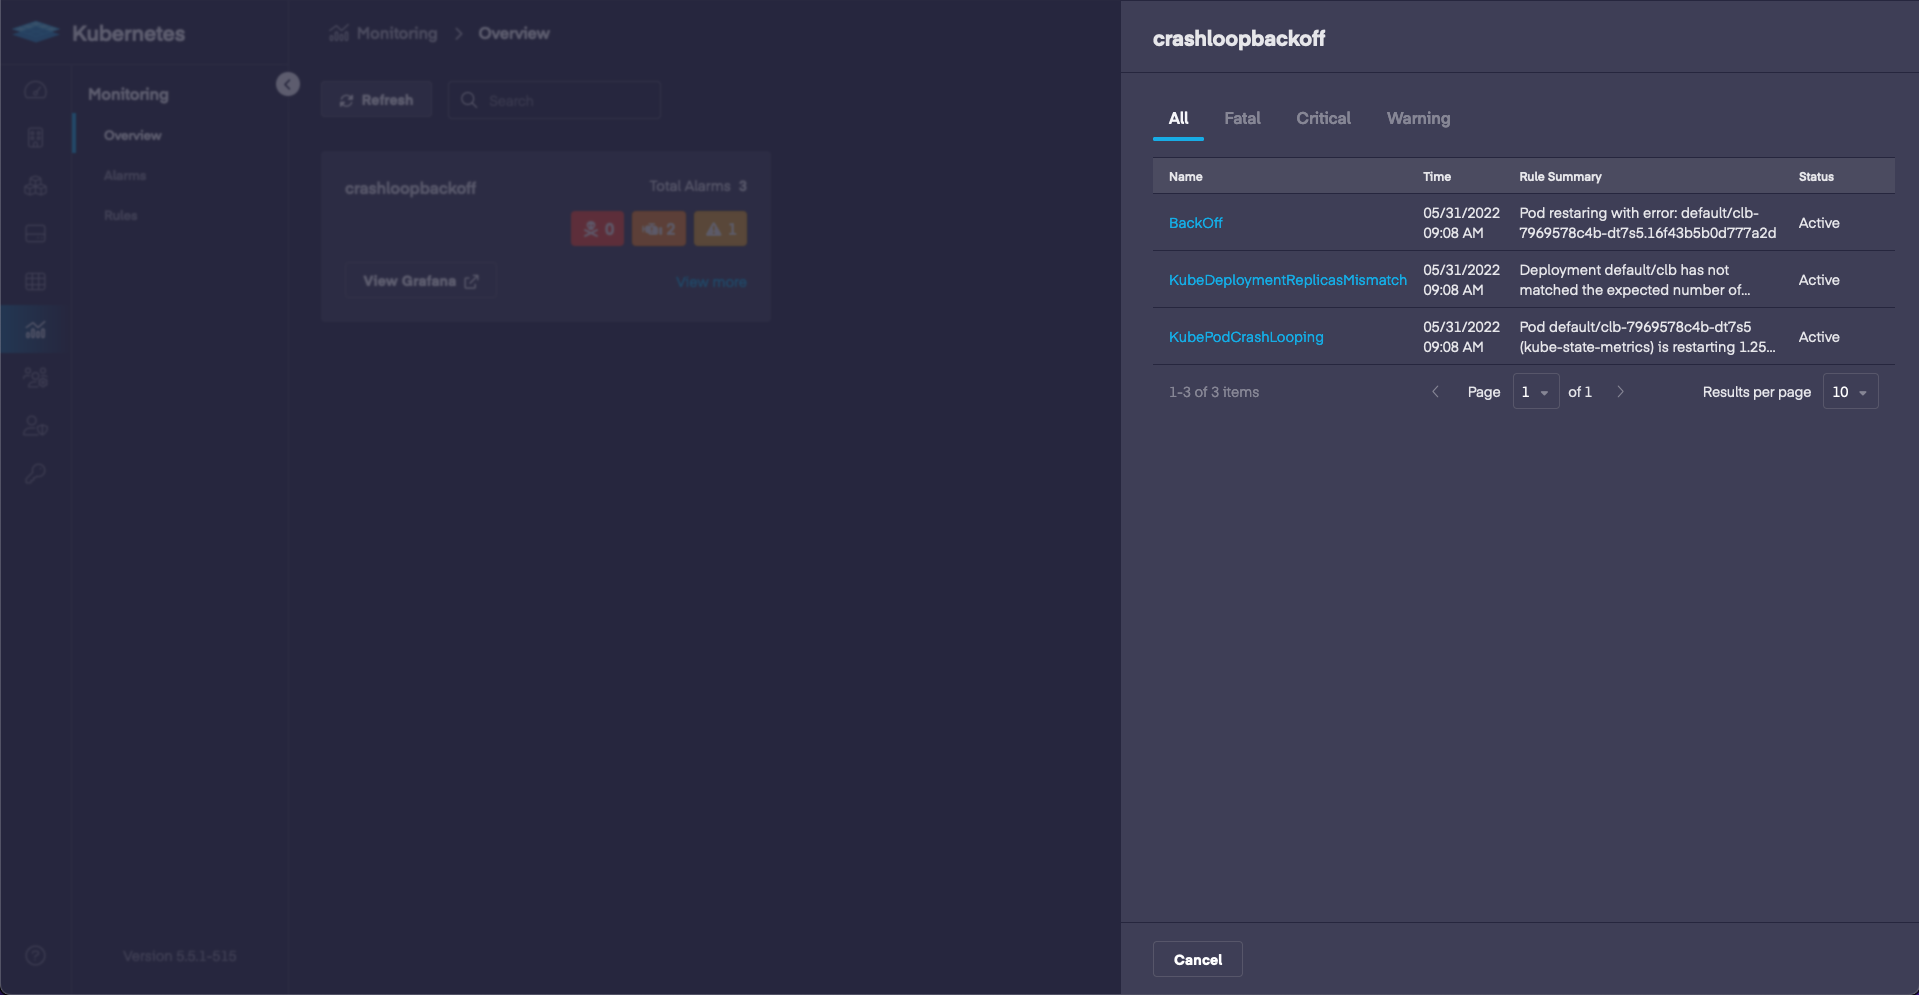
If we drill down into the error we can see the pod in the Alarm Summary section. The clb pod is running into errors!

Conclusion
In this post we talk about how to troubleshoot CrashLoopBackOff, however many of the steps can be used to troubleshoot other errors we may run into related to most services. Viewing the error status and then expanding on it with describe can be useful in troubleshooting Kubernetes issues.
Check out our Signup page if you want to try Platform9 for free: https://platform9.com/signup/ |